Tuesday, May 27, 2014

What Would/Does Modern Polygamy Look Like?

The most common human mating pattern is monogamy, the next most common polygyny (one husband, two or more wives), then polyandry (one wife, two or more husbands). Tibet had both polyandry and polygyny. I know of no society where group marriages (two or more of each) were common, but examples have existed, such as the Oneida commune in 19th century New York and various smaller groups in the 1960's and thereafter.

Under current U.S. law, although monogamy (including same sex monogamy) is the only form of marriage legally recognized, there do not seem to be any serious legal bars in most states to de facto polygamy. All three forms, although uncommon, exist. It is interesting to speculate on what forms polygamy might take in the future in modern developed societies, given  a technological and economic environment different from the environment of past polygamous societies.

On the technological side, two big changes are reliable contraception and paternity testing. The latter solves the most obvious problem with polyandry. Men want to know whether a child is theirs. In the past, the only reliable way of doing so was for the man to have had exclusive sexual access to the child's mother; now all it takes is a reliable lab. So we could have several husbands sharing a wife who bears children by all of them, with each taking a special interest in his own children. The selective use of contraception would even make it possible to decide in advance which men would father children and how many. 

One function of marriage is to produce and rear children, another is sexual pleasure. One woman is physically capable of satisfying several men and some women might enjoy doing so. Reliable contraception makes it more practical than in the past to delink sex from marriage, and to a considerable extent it has happened. But keeping sex within a small group has an obvious advantage for reducing the risk of sexually transmitted diseases and may also make better use of the emotional concomitants of intercourse.

Why polyandry instead of monogamy? Modern technology provides ways in which parents can choose to raise the odds of producing a son, and the result in some societies is a substantial m/f imbalance in the population. Polyandry would make it possible in such a society for the excess men to have wives and families.

What about polygyny, the historically more common form of polygamy? It provides a solution to a different problem. Back when legalized abortion and readily available contraception first became hot political issues, a major argument in favor of both was preventing the birth of unwanted children, meaning children born to unmarried mothers. Both legalized abortion and readily available contraception now exist in most developed societies—and have been accompanied by the precise opposite of the predicted effect, a sharp increase in the number of children born to single mothers.

One possible explanation is that, in a world where intercourse was likely to lead to pregnancy, most women were unwilling to sleep with a man unless he was prepared to offer support to any resulting offspring, typically by being engaged or married to her. Breaking that link meant that women who did not want children and did enjoy sex were willing to engage in it without such a guarantee, which sharply worsened the bargaining position of women who wanted sex, children, and support. Some of those who could not find husbands chose to produce children without them. Polygyny would offer some of them the more attractive alternative of being one of two or more wives of men who wanted children and had sufficient resources to support them. And for such men, it provides more sexual variety than monogamy, more emotional security and less medical risk than promiscuity. Also more children.

So far I have been looking at marriage primarily from the standpoint of sex and children. It is also an institution for the production of household services and the sharing of income. In one traditional form of monogamy there was a fairly sharp division of labor, with the wife running the household and the husband working outside it to bring in income. The combination of low rates of infant mortality, meaning that a family that wants to end up with two children need only produce two, and modern technology—washers and dryers, dishwashers, microwave ovens, food bought already prepared—has converted household production from a full time to a part time job. The usual modern response is for both partners to earn income outside of the household, possibly with one of them, usually the wife, taking some years off for child rearing. An alternative, possibly a superior alternative, would be a family of three or more, with one member specializing in running the household and caring for the children.

One additional feature of modern society might affect how practical various forms of marriage would be. We are used to taking it for granted that most income earning is done outside of the household. That has not always been the case in the past—a common pattern has been for family members to be self employed running a shop or a farm. Telecommuting may make something similar again common. The problem of having someone home to keep an eye on the children is substantially reduced if parents who work do their work at home.

All of this is mostly speculation. Over the years I have occasionally encountered people who were part of polygamous families of one sort or another, but have never done much research into how or why they were organized. There is a literature, largely online, on polyamory, but it seems to deal more with structuring the emotional relationships than with organizing production, child rearing, and associated activities.

Comments welcome, especially from those with first hand experience.

Sunday, May 18, 2014

How One Might Climb Over the Great Firewall

One minor irritation on my recent trip to China was discovering that Facebook and Google+, where I normally waste time arguing with people, were both blocked, as was blogspot and hence my own blog—the reason this post is only going up now, from Hong Kong. I gather that locals have ways of evading the restrictions but do not know the details. Which lets me try to figure out how I would do it.

The obvious solution is a proxy server. You connect to it from inside China, it connects you to any other site you like, blocked or not. The obvious problem is that whoever is doing the blocking notices and blocks the proxy server. To which one less obvious and so more interesting solution is …  .

Start with ten thousand proxy servers—or at least ten thousand URL’s, possibly all connected to the same hardware. You email each of your customers a URL to use. 

Unfortunately, some of your customers are spies, employees of whatever state organization does the blocking. They report the URL’s they get to their employer, who blocks them.

At which point you observe which URL's are blocked and note which of your customers got those URL's, hence which of your customers you suspect of being spies. Since customers who got the blocked URL’s now cannot access your server, you send them new URL’s—a different new URL for each of them. You observe which of those get blocked. You now have a pretty good guess which of your customers are spies.

So you have one set of URL’s for the spies, another for everyone else. Whenever a URL gets blocked, you send the customers who had that one a new URL—and add those customers to your list of possible spies. You continue with a policy of sending real customers URL’s that don’t go to confirmed spies and updating your list of confirmed spies on the basis of which URL’s get blocked.

So far as I can tell it should work. I have no idea whether or not I have just reinvented something close to what already exists.

In Praise of Shanghai

I’ve just spent four days in Shanghai, my first visit ever to mainland China, and I like the place. There is street food everywhere, people are friendly, the architects who built the skyscrapers were crazy enough to put a model of half a planet on top of one and of a space station on another.

The evening before I left I went for a walk in the park near my hotel. There was music playing, I suspect from a boom box, and couples, many of them middle aged, dancing to it, not very well. In the same park the next morning there were people doing tai chi exercises, others doing slow motion dance moves, in groups, to music. The feel of the place is almost the precise opposite of a communist stereotype—it feels as though everyone is energetically doing what he wants and half the population are small scale entrepreneurs. The typical "department store" is a large building occupied by (I'm guessing) a couple of hundred tiny stores, with what they sell sorted to some degree by floors of the building.

One interesting question is whether China, at this point, is more or less capitalist than the U.S. So far as Shanghai is concerned, my guess is less in theory but more in practice. I was told that there are regulations on who can cut hair or sell food out of a cart on the street but they are not enforced very energetically and can be dealt with if necessary by a modest bribe to the policeman who is supposed to enforce them.

I am only posting this today, after arriving in Hong Kong, because in Shanghai (and later Xiamen) I was blocked from either reading or writing to my blog (or Facebook, or G+, which left more time free for exploring China), presumably by the Great Firewall. Here too, the restriction is more in theory than in practice. I gathered that most of the Chinese I spoke with had unrestricted access to the internet via a VPN that manages to evade the firewall.

Which provides a subject for my next post.
 

Saturday, May 10, 2014

Korean Puzzles

I've just spent a pleasant few days in Seoul and I have two questions:

1. Why is it that a majority of the population shares a single last name (Kim)?

2. There is no place in Seoul where one is more than a few hundred feet from someone selling food (casual observation, not scholarly claim). Diet soft drinks are considerably less common in Korea than in the U.S. Yet almost nobody is fat. Why?

Korea v China: A Natural Experiment

Until the 15th century, Koreans wrote using Chinese characters. During that century, they invented an alphabet, Hangul, which a linguist of my acquaintance used to describe as the best alphabet ever created.  Learning to read and write in Chinese characters took a very lengthy education. Learning to read Hangul, for someone who knew Korean, should have taken only a few days, long enough to memorize the sounds of the letters. So the introduction of Hangul should have converted Korea from a society where only the elite were literate to a society where almost everyone was.

China retained the traditional writing system. So the history of the two countries ought to provide information on the effect of widespread literacy. In what ways in which the societies were similar before Hangul did they diverge thereafter?

I don't have an answer, but it occurred to me that someone much more expert in the history of both countries might.

Thursday, May 01, 2014

How to Board an Airplane

I've just read an article on different ways of getting passengers onto an airplane, arguing that South-western's current method is the best of those used, although there is at least one alternative that is better still. The article did not consider the method that has long struck me as the obvious solution to the problem—and that no airline, so far as I know, uses.

South-western lines up passengers in an order mainly determined by when they checked in, then lets them choose their own seats as they board. My method uses the same mechanics—lining passengers up in a predetermined order—but in what should be a much more efficient way.  Instead of lining them up by priority, line them up by seat number. The first two people in line are the ones in the window seat of the last row. The next two are in the window seat of the next row forward, and so on to the window seats of the first row. Next come the two in the middle seats ordered in the same way, then finally those in the aisle seats. 

The advantage seems obvious—since passengers go on in the order of their seats, nobody ever has to wait for a passenger in front of him in line but seated ahead of him. Since the rows fill from the window in, nobody has to wait for someone in his row to get out before he can get in. One might argue that passengers will be unwilling to go along with such an elaborate arrangement—but the mechanics are exactly the same as way South-western does now. The only difference is that the order actually serves a function.

What am I missing? Why don't the airlines do it that way?

Tuesday, April 29, 2014

Someone I Would Like to Argue With

I’ve been reading an interview with James Lovelock, famous largely for the Gaia Hypothesis, which always looked a bit nutty to me. He sounds like an interesting man. Unlike most people in public controversies, he is willing to admit that he was wrong:
The Revenge of Gaia was over the top, but we were all so taken in by the perfect correlation between temperature and CO2 in the ice-core analyses [from the ice-sheets of Greenland and Antarctica, studied since the 1980s]. You could draw a straight line relating temperature and CO2, and it was such a temptation for everyone to say, “Well, with CO2 rising we can say in such and such a year it will be this hot.” It was a mistake we all made.

We shouldn’t have forgotten that the system has a lot of inertia and we’re not going to shift it very quickly. The thing we’ve all forgotten is the heat storage of the ocean — it’s a thousand times greater than the atmosphere and the surface. You can’t change that very rapidly.
He is dismissive of pop-catastrophism, as in the case of Fukushima, pointing out that “Twenty-six thousand people were killed by the magnitude-9 earthquake and tsunami [that caused the nuclear meltdown], and how many are known to have been killed by the nuclear accident? None.”

He is skeptical about the chance of any political solution to climate change, arguing for adaptation rather than prevention, and, if I interpret him correctly, recognizing that getting the English to save England is a more viable strategy than getting them to try to help save the world. And he recognizes that the future is very uncertain. Responding to a question about what the next 100 years will be like with:
That’s impossible to answer. All I can say is that it will be nowhere as near as bad as the worst-case scenario.
I expect that I would disagree with a fair number of his views, but he sounds like someone it would be fun to argue with.

Wednesday, April 23, 2014

Is the IPCC High Emissions Scenario Impossible?

A commenter here a while back argued that RCP 8.5, the highest emission scenario in the current IPCC report, is impossible, because it requires more coal than is available to be mined. I recently came across a more detailed version of that argument in a published piece by David Rutledge, a Caltech professor.

The argument is straightforward. Estimates of coal reserves are much more reliable than estimates of reserves of oil and gas, coal being a solid. Such  estimates have been made for more than a century and actual quantities mined have, so far, been consistent with them. In particular:
for coal the pattern has been that countries produce only a small fraction of their early reserves, and then late in the production cycle the reserves drop to match the coal at the last working mines. This pattern is seen in the UK (cumulative production of 19% of early reserves), Pennsylvania anthracite (42%), the Ruhr Valley (14%), France and Belgium (23%), and Japan and South Korea (21%). This means that the reserves criteria have been too optimistic, but it also means that world coal reserves are a good upper bound on future production.
By the author's calculation, RCP 8.5 requires the world to consume 200% of total coal reserves by 2100, 700% by 2500. If he is correct, it follows that RCP 8.5 ought not to be included in the IPCC graphs showing possible future climate change and that maximum values of temperature change or sea level rise ought not to include the values it would imply.

I have two questions for readers:

1. Can anyone point at a serious mistake in the argument? Does it misstate the amount of coal consumption implied by RCP 8.5, the size of coal reserves as currently estimated or the reasons to think that current estimates represent a reasonable upper bound?

2. Is there anyone here otherwise inclined to support the IPCC who, having looked at this argument, agrees that the inclusion of RCP 8.5 in the report is fraudulent, an attempt to make risks of future warming look worse than they actually are?

Sunday, April 13, 2014

AGW, Considered as a Black Swan

In my previous post I took issue with Lovejoy's claim to show, by statistical analysis of global temperature data since 1500, that the probability that natural processes would produce the amount of warming observed in the period 1880 to 2008 was less, probably much less, than one in a hundred. My complaint was not with his conclusion, which might well be true, but with his argument.

In order to calculate the probability that what happened would happen as a result of natural causes of temperature change, Lovejoy needed a probability distribution showing what the probability was of a natural cause producing any given temperature change. He could estimate that distribution by looking at changes over the period from 1500 to 1880 on the (plausible) assumption that humans had little effect on global temperature over that period. But that data could not tell him the probability distribution for events rare enough to be unlikely to show up in his data, for instance some cause of warming that occurred with an annual probability of only .001.

His solution to that problem was to assume a probability distribution, more precisely a range of possible distributions, fit it with the data he had and deduce from it the probability of the rare large events that might have provided a natural cause for 20th century warming. That makes sense if those events are a result of the same processes as the more frequent events, just less likely versions of them—just as flipping a coin and getting eight heads in a row is a result of the same processes that give you four, five, or six heads in a row. But it makes no sense if there are rare large events that are produced by some entirely different process, one whose probability the observed events tell us nothing about—if, for instance, you got four heads in a row by sheer luck, forty heads in a row because someone had slipped you a two headed coin. The forty heads, or the hypothetical rare cause of large warming, would be a black swan, an event sufficiently rare that it had not been observed and so was left out of the calculation.

It occurred to me, after considering a response by Lovejoy and a comment on the Google+ version of my post, that not only was such a black swan event possible in the context of climate, one had occurred. AGW itself is a black swan, a cause of rapid warming whose probability cannot be deduced by looking at the distribution of climate change from the period 1500 to 1880.

If the point is not clear, imagine that Lovejoy wrote his article in 1880. Since warming due to human activity had not yet occurred, there would be no reason for him to distinguish between causes of warming and natural causes of warming. He would interpret the results of his calculations as showing that the probability of warming by a degree C over the next 128 years was less, probably much less, than .01. He would be assuming away the possibility of some cause of substantial warming independent of the causes of past warming, one whose probability could not be predicted from their probability distribution.

That cause being, of course, greenhouse gases produced by human action.


Two Problems With the 1% Claim

A number of news stories claim that a recent paper by Lovejoy proves that the probability that the warming of the past century is entirely due to natural causes is less than one percent. I find the conclusion plausible enough, but, so far as I can tell, there is no way that it can be derived in the way Lovejoy is said to have derived it.

The first problem, probably the fault of the reporters not of Lovejoy himself, is the misinterpretation of what the confidence result produced by classical statistics means. If you analyze a body of data and reject the null hypothesis at the .01 level, that means that if the null hypothesis is true, the probability that the evidence against it would be as strong as it is is less than .01—the probability of the evidence conditional on the null hypothesis. That does not imply that the probability that the null hypothesis is true given that the evidence against it is that strong is less than .01—the probability of the null hypothesis conditional on the evidence. The two sound similar but are in fact entirely different. 

My standard example is to imagine that you pull a coin out of your pocket, toss it without inspecting it, and get heads twice. The null hypothesis is that it is a fair coin, the alternative hypothesis that it is a double headed coin. The chance of getting two heads if it is a fair coin is only .25. It does not follow that, after getting two heads, you should conclude that the probability is .75 that the coin is double headed. For previous discussions of this issue see this one in the contest of World of Warcraft and this in the context of DNA analysis of mummies.

The second problem is that, so far as I can tell, there is no way Lovejoy could have calculated the probability that natural processes would produce 20th century warming from the data he was using, which consisted of a reconstruction of world temperature from 1500 to the present. The paper is sufficiently complicated so that I may be misinterpreting it, but I think his procedure went essentially as follows:
Assume that changes in global temperature prior to 1880 were due to random natural causes. Use the data from 1500 to 1875 to estimate the probability distribution of natural variation in global temperature. Given that distribution, calculate the probability that natural variation would produce as much warming from 1880 to 2008 as occurred. That probability is less than .01. Hence reject the assumption that warming from 1880 on was entirely due to natural causes at the .01 level.
The problem with this procedure is that data from 1500 on can only give information on random natural processes whose annual probability is high enough so that their effect can be observed and their probability calculated within that time span. Suppose there is some natural process capable of causing a global temperature rise of one degree C in a century whose annual probability is less than .001. The odds are greater than even that it will not occur even once in Lovejoy's data. Hence he has no way of estimating the probability that such a process exists. The existence of such a process would provide an explanation of 20th century warming that does not involve human action. So he cannot estimate, from his data, how likely it is that natural processes would have produced observed warming, which is what he is claiming to do. 20th century warming would, in that case, be what Taleb refers to as a Black Swan event. If one swan in a thousand is black, the observer looks at five hundred swans, finds all of them white, and concludes, incorrectly, that the probability of a black swan is zero.

How does Lovejoy solve that problem? If I correctly read the paper, the answer is:
Stated succinctly, our statistical hypothesis on the natural variability is that its extreme probabilities ... are bracketed by a modified Gaussian...
In other words, he is simply assuming a shape for the probability distribution of natural events that affect global climate. Given that assumed shape, he can use data on the part of the distribution he does observe to deduce the part he does not observe. But he has no way of testing the hypothesis, since it is a hypothesis about a part of the curve for which he has no data.

If I am correctly reading the paper—readers of this post are welcome to correct me if they think I am not—that means that Lovejoy has not only not proved what reporters think he has, he has not proved what he thinks he has either. A correct description of his result would be that the probability that natural processes would produce observed warming, conditional on his assumption about the shape of the probability distribution for natural processes that affect global temperature, is less than .01.

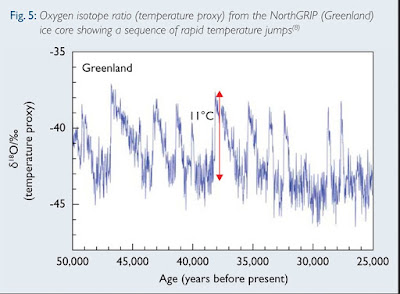
One obvious question is whether this problem matters, whether, on the basis of data other than what went into Lovejoy's paper, one can rule out the possibility of natural events capable of causing rapid warming that occur too infrequently for their probability to be deduced from the past five hundred years of data. I think the answer is that we cannot. The figure below is temperature data deduced from a Greenland ice core. It shows periods of rapid warming, some much more rapid than what we observed in the 20th century, occurring at intervals of several thousand years. During one of them, "The temperature increased by more than 10°C within 40 years." The temperature shown is local not global—we do not have the sort of paleoclimate reconstructions that would be needed to spot similar episodes on a global scale. But the fact that there are natural sources of very rapid local warming with annual frequency below .001 is an argument against ruling out the possibility that such sources exist for global warming as well.


In my next post, I pointed out that not only was it possible that there existed a low probability process capable of producing rapid warming whose cause and hence  probability was independent of the higher probability processes Lovejoy observed, it appears to have actually happened—certainly Lovejoy believes it did. AGW itself is a black swan in precisely the sense discussed above.

Wednesday, April 09, 2014

A Few More Bits from the IPCC Fifth Assessment Report

(Chapter 10, Second draft)
An assessment of the observational evidence indicates that the AR4 conclusions regarding global increasing trends in hydrological droughts since the 1970s are no longer supported. ... we conclude there is low confidence in attributing changes in drought over global land since the mid-20th century to human influence.
Contrast that to all the claims blaming the current California drought on global warming.
The average global cyclone activity is expected to change little under moderate greenhouse gas forcing

Globally, there is low confidence in any long term increases in tropical cyclone activity (Section 2.6.3) and low confidence in attributing global changes to any particular cause.
Or, in other words, Chris Landsea was right.
Anthropogenic warming remains a relatively small contributor to the overall magnitude of any individual short-term event because its magnitude is small relative to natural random weather variability on short time scales. Because of this random variability, weather events continue to occur that have been made less likely by human influence on climate, such as extreme winter cold events ...
Contrast the final sentence to occasional claims that recent unusual cold is evidence for, not against, "climate change."
 
The chapter also contains a graph showing estimates of northern hemisphere temperature over the past 1200 years. It appears from the green lines, due to Michael Mann of hockey stick fame, that the medieval warm period is back, with a peak close to current temperature. 
 

Monday, April 07, 2014

Ocean Warming Data

I have several times seen the claim that, despite the apparent pause in surface temperatures, global warming is actually going faster than ever, with the missing heat in the ocean. So far I have seen no support for that claim. I did, however, recently come across an article discussing global heat content changes and problems in estimating them that contains an interesting graph.

As best I can tell, the different lines represent different ways of estimating the values, given the data limitations, with data becoming available later for the deeper depths; the vertical lines show, for each depth, the date when global coverage reached 50%. So the bottom graph is the best in terms of how deep it goes, the worst in quality of the data.

The  pattern seems pretty clear. Slow warming until about 1996, faster from then until about 2004, slower to zero warming thereafter.

Another Critic of Cook et. al. 2013

Readers will be familiar with my critique of Cook et al. 2013, an article widely cited as showing that 97% of climate researchers support "the consensus position." I have just come across a much more detailed criticism of the paper on other grounds, by someone much more extensively involved in climate issues than I am.