Showing posts sorted by relevance for query agw. Sort by date Show all posts

Monday, September 26, 2016

Mortality From AGW Warming: A Brief Analysis

In a recent FaceBook exchange, the question came up of why I object to the omission from most talk about AGW of the benefits from milder winters. I ended up sketching an approach to the question of whether increased mortality from hotter summers was more or less than decreased mortality from milder winters. It was a longer piece than I usually bother with on FaceBook, which suggested that it would be more appropriate here, so here, with some editing, it is.

I begin with a Lancet article that found that, globally, "cold-related deaths outnumbered heat-related deaths by a factor of nearly 20, overall." To figure out how summed deaths from heat and cold were changed by AGW so far, or estimate how they will be changed in the future, I need two more pieces of information.

1. As temperature rises, what is the relative rise in temperature of winters relative to the rise in temperature of summers. I don't have data on that and it surely varies from place to place, but the physics of greenhouse gas warming implies that it will tend to be larger in cold times than in hot, so I would expect that, on average, winters will get milder by more than summers get hotter. I picked up that point from something Freeman Dyson mentioned in The Scientist as Rebel, and so far as I can tell it is correct.

2. What is the marginal effect on mortality of changes in both highs and lows? What is the percentage increase in mortality due to heat if highs go up by one degree? What is the percentage decrease in mortality due to cold if lows go up by one degree? How do they compare?

So far as I know, data on that do not exist. So I start with the simplest assumption—that the marginal effects are the same. If so, raising both the high and the low by one degree will decrease mortality due to cold by almost twenty times as much as it increases mortality due to heat, as per the Lancet numbers. Since, as per my point 1 above, AGW will on average increase lows by more than it increases highs, a given increase in global temperature due to AGW should decrease mortality due to cold by more than twenty times the amount it increases mortality due to heat.

If the question is whether the net effect is an increase or decrease in total mortality, the argument implies that for the net to be an increase in mortality the marginal effect of higher highs has to be more than twenty times as great as of higher lows. I suppose that's possible but I can not see any reason to expect it. Perhaps someone reading this can point me at data on the marginal effect that would let me replace my guess with something better.

In my experience, news stories on global warming routinely cite figures on increased deaths from hotter summers, current or projected, but give no such figures for decreased deaths from milder winters.

P.S. The Physics

CO2 is a greenhouse gas. So is water vapor. The more of one greenhouse gas in the atmosphere, the less the effect of adding another–the combined effect, after all, cannot be to block more than a hundred percent of the long wave radiation coming up from the Earth. The warmer it is, ceteris paribus, the more water vapor is in the air. Hence the greenhouse effect tends to be less in warm times and places than in cold.

Saturday, September 26, 2015

CAGW and Consensus

Some years ago, Richard Tol published an article in the Journal of Economic Perspectives that pooled the work of everyone in the field to produce estimates of the net effect of various levels of warming, measured relative to pre-industrial temperatures. It included a graph showing estimated net cost, with an error range. The green lines show his results after correcting some errors in the original paper.
   

The solid green line shows the estimate. It is positive up to about two degrees, negative thereafter. The dashed lines are the boundaries of the 95% range. The high end (optimistic) does not go negative until 3°C.

What about the low end? At 3°C, the welfare impact is a reduction of 10%. The IPCC high emissions scenario, RCP8.5, which gets us to that temperature sometime in the second half of the century, assumes continued economic growth. If so, the 10% reduction in welfare due to AGW will be combined with an increase several times that large.

My previous post discussed an article in the Journal of the National Academy of Sciences which criticized the IPCC models and concluded that warming due to AGW had been reasonably stable for the past century at a little less than one degree/century. If that continues, by 2100 global temperature will be less than two degrees above its preindustrial level. On Tol's estimate, we will be better off than if there had been no AGW, worse off than if AGW had been a little slower. 

If, on the other hand, we accept RCP8.5, when we reach the 3° mark we will be worse off than if warming had not occurred, better off than we are now—even if we take the low end of Tol's predicted range of effects.

Which I think is an adequate response to people who tell me that to deny catastrophic effects of warming is to ignore the scientific consensus.

Wednesday, February 17, 2016

Making Sense of Bits of the Argument

Many parts of the argument over AGW are sufficiently complicated so that, unless you are a professional in the field, there is no good way of telling who to believe. The result is that most people simply believe whatever story supports what they see as their side. An example would be the question of whether AGW will increase or decrease food supplies.

Once in a while, however, someone offers a contribution to the debate that is obviously dishonest—obviously enough so that a careful reader can spot the trick. The fact that there are dishonest people on one side or the other of the argument does not tell you that that side is wrong. But how their argument is treated by other people on that side does give you some information on who you should or should not trust. Any source of information—newspaper, web page, scientific journal, blog—that takes seriously work which a careful reader can see is dishonest should not be trusted, since it is either dishonest or incompetent.

I have two and a half examples from the CAGW side of the argument, the claim that, unless we take strong measures to slow AGW, the net results will be very bad. One is an article that tries to obscure the positive effect of CO2 fertilization by claiming that a change which increases the yield of every nutrient threatens human nutrition—because it increases some by more than others. One is the source of the much quoted 97% figure, along with a later piece in which the lead author misrepresents the result of his own work. One is a piece in a high profile popular publication by an economist arguing that AGW is a threat that requires immediate action—and reporting results of his own research that imply the opposite, but reporting them in a form that hides the fact. I count that as a half because I am not sure that the deception was deliberate.

What I find depressing is how few people, faced with clear evidence that someone on their side of the argument is dishonest, are willing to accept it.

I invite people to offer similar examples on the other side. They should be publications by respectable figures that meet two conditions:

1. They are obviously dishonest--obvious enough so that the demonstration does not depend on trusting some other source with the opposite bias.

2. They are taken seriously by lots of reputable people on that side of the argument.

Wednesday, February 26, 2014

A Climate Falsehood You Can Check for Yourself

One problem in arguments about climate (and many other things) is that most of the information is obtained at second, third, or fourth hand, with the result that what you believe depends largely on what sources of information you trust. One result is that people on either side of the argument can honestly believe that the evidence strongly supports their view. They trust different sources; different sources report different evidence. It is thus particularly interesting when on some point, even a fairly minor one, you can actually check a claim for yourself. I believe I have found an example of such a claim.

Cook et. al. (2013) is the paper, possibly one of two papers, on which the often repeated claim that 97% of climate scientists support global warming is based. Legates et. al. (2013) is a paper which criticizes Cook et. al. (2013). Bedford and Cook (2013) is a response to Legates et. al. All three papers (the last a pre-publication version) are webbed, although Legates et. al. is unfortunately behind a pay wall.
Bedford and Cook (2013) contains the following sentence: "Cook et al. (2013) found that over 97% endorsed the view that the Earth is warming up and human emissions of greenhouse gases are the main cause."
To check that claim, look at Cook et. al. 2013. Table 2 shows three categories of endorsement of global warming reflected in the abstracts of articles. Category 1, explicit endorsement with quantification, is described as "Explicitly states that humans are the primary cause of recent global warming." Category 2 is explicit endorsement without quantification. The description, "Explicitly states humans are causing global warming or refers to anthropogenic global warming/climate change as a known fact" is ambiguous, since neither "causing" nor "anthropogenic global warming" specifies how large a part of warming humans are responsible for. But the example for the category is clearer: 'Emissions of a broad range of greenhouse gases of varying lifetimes contribute to global climate change.' If human action produces ten percent of warming, it contributes to it, hence category 2, as implied by its label, does not specify how large a fraction of the warming humans are responsible for. Category 3, implicit endorsement, again uses the ambiguous "are causing," but the example is '...carbon sequestration in soil is important for mitigating global climate change,' which again would be consistent with holding that CO2 was responsible for some but less than half of the warming. It follows that only papers in category 1 imply that "human emissions of greenhouse gases are the main cause." Authors of papers in categories 2 and 3 might believe that, they might believe that human emissions of greenhouse gases were one cause among several.
Reading down in Cook et. al., we find "To simplify the analysis, ratings were consolidated into three groups: endorsements (including implicit and explicit; categories 1–3 in table 2)." It is that combined group, ("endorse AGW" on Table 4) that the 97.1% figure refers to. Hence that is the number of papers that, according to Cook et. al., implied that humans at least contribute to global warming. The number that imply that humans are the primary cause (category 1) is some smaller percentage which Cook et. al. do not report.

It follows that the sentence I quoted from Bedford and Cook is false. Cook et. al. did not find that "over 97% endorsed the view that the Earth is warming up and human emissions of greenhouse gases are the main cause." (emphasis mine). Any interested reader can check that it is false by simply comparing the two papers of which Cook is a co-author. John Cook surely knows the contents of his own paper. Hence the sentence in question is a deliberate lie.

That Cook misrepresents the result of his own research does not tell us whether AGW or CAGW is true. It does not tell us if it is true that most climate scientists endorse AGW or CAGW. It is nonetheless interesting, for two related reasons.

In recent online exchanges on climate, I repeatedly encountered the claim that 97% of climate scientists believed humans were the main cause of global warming. That included an exchange with one of the very few reasonable and civil supporters of the CAGW claim that I encountered in the online arguments, where most participants on either side are neither. So far as I know, the paper says nothing that is not true. But it appears designed to encourage the misreading that actually occurred. It does so by lumping together categories 1-3 and reporting only the sum and by repeatedly referring to "the consensus" but never stating clearly what that consensus is. 

The closest it came to defining the consensus is as the "position that humans are causing global warming," which leaves it unclear whether "causing" means "are one cause of," "are the chief cause of," or "are the sole cause of." To discover that it meant only the former, a reader had to pay sufficiently careful attention to the details of the paper to notice "contribute to" in the example of category 2 in Table 2, which few readers would do. The fact that Cook chose, in a second paper, to misrepresent the result of the first is pretty good evidence that the presentation of his results was deliberately designed to mislead.

There is a second, and more important, reason why all of this matters. Beliefs on either side depend largely on what sources of information you trust. I have now provided unambiguous evidence, evidence that anyone on either side willing to carefully read Cook (2013) and check what it says against what Bedford and Cook claims it says can verify for himself, that John Cook cannot be trusted. The blog Skeptical Science lists John Cook as its maintainer, hence all claims on that blog ought to be viewed with suspicion and accepted only if independently verified. Since, as a prominent supporter of the position that warming is primarily due to humans and a very serious threat, Cook is taken seriously and quoted by other supporters of that position, one should reduce one's trust in those others as well. Either they too are dishonest or they are over willing to believe false claims that support their position.

The fact that one prominent supporter of a position is dishonest does not prove that the position is wrong. For all I know, there may be people on the other side who could be shown to be dishonest by a similar analysis. But it is a reason why those who support that side because they trust its proponents to tell them the truth should be at least somewhat less willing to do so.

P.S. A commenter has located the data file for Cook et. al. (2013). By his count, the number of articles classified into each category was:

Level 1 = 64
Level 2 = 922
Level 3 = 2910
Level 4 = 7970
Level 5 = 54
Level 6 = 15
Level 7 = 9

The 97% figure was the sum of levels 1-3. Assuming the count is correct—readers can check it for themselves—that 97% breaks down as:

Level 1: 1.6%
Level 2: 23%
Level 3: 72%

Only Level 1 corresponds to "the Earth is warming up and human emissions of greenhouse gases are the main cause." (emphasis mine) Hence when John Cook attributed that view to 97% on the basis of his Cook et. al. (2013) he was misrepresenting 1.6% as 97%. Adding up his categories 5-7, the levels of rejecting of AGW, we find that more papers explicitly or implicitly rejected the claim that human action was responsible for half or more of warming than accepted it. According to Cook's own data.

Would anybody now like to claim that lumping levels 1, 2, and 3 together and only reporting the sum was not a deliberate attempt to mislead?

P.S. John Cook eventually responded to my criticism, not here but on the comment thread of another blog that linked to this one. See his response and my comments on it here.

Friday, December 11, 2015

Not a Conspiracy

Someone on the FaceBook Climate Change group asked a reasonable question:
I'm trying to understand this big conspiracy everyone keeps hinting at, but never explains, now lets say AGW is a complete Hoax and Obama has somehow tricked the world to help him to trick americans to pay more taxes and put solar panels on their roof, now can someone explain how this evil conspiracy works, like who wins,who profits from this con, , what is the end game...?
I thought my response might be of interest to readers here:

"Conspiracy" is too simple. There are a variety of reasons why different people wildly exaggerate the implications of AGW. They include:

Politicians in poor countries who want to use claims of harm to their countries to get rich governments to give th
em money.

Politicians in rich countries who want arguments for subsidizing firms run by their supporters, passing regulations that give them power, collecting taxes, and a variety of other things.

News media that want to get readers. "Global warming is going to flood New York City" is a better story than "Global warming has raised sea levels by eight inches over the past century and might raise them by another couple of feet by the end of this century."

People who want to pretend to themselves and others that they are part of the intellectual elite, know important things that others deny.

People who like imagining catastrophe. You see the same pattern on the other side of the political spectrum with survivalists, and more generally with collapse of civilization science fiction.

The combined effect has been to convert positions on global warming from a scientific dispute to an identity marker for ideology. You can see the effect reading this group--people keep wandering away from climate questions to gun control or whether Obama is good or bad or other things linked to ideology.

Once you have that linkage, there is strong pressure on either side to take more extreme positions. Believing that global warming is a problem marks you as a loyal member of the blue tribe. So believing that it is a really big problem marks you as a very loyal member, whereas suggesting that it might be a minor problem marks you as a possible traitor to tribal loyalty. Similarly on the other side. Doubting the catastrophic story is all very well--but it's a stronger signal of red tribe loyalty to claim that warming is a fraud due to doctored figures, or that you have a scientific proof that AGW is wrong, or ... .

Tuesday, June 09, 2015

Judging Outside Your Expertise

I have just been involved in a lengthy exchange on Facebook over my criticism of the claim that warming on the scale projected by the IPCC for 2100 can be expected to have large net negative consequences. The response I got was that the person I was arguing with was not interested in my arguments. He does not know enough to judge for himself whether the conclusion is true, so prefers to believe what the experts say.

Accepting the views of experts on a question you are not competent to answer for yourself, assuming that you can figure out who they are and what they believe, is often a sensible policy, but one can sometimes do better. Sometimes one can look at arguments and evaluate them not on the basis of the science but of internal evidence, what they themselves say. Here are three examples:

The widely cited 97% figure is based mostly on Cook et. al. 2013, which is webbed. It is often reported as the percentage of climate scientists who believe that humans are the main cause of warming and that warming will have very bad effects. Simply reading the article tells you that the second half is false. The article is about causes of warming and offers no evidence on consequences. Anyone who says it does is either ignorant or dishonest, and other things he says can be evaluated on that basis.

If you read the article carefully you discover that the 97% figure, which is a count of article abstracts not scientists, is the percentage of abstracts which say or imply that humans are *a* cause of warming (“contribute to” in the language of one example). The corresponding figure for humans as the principal cause, which is not given in the article but can be calculated from its webbed data, is 1.6%. That tells you that anyone who reports the 97% figure as the number of articles holding that humans are the main cause of warming is either ignorant or dishonest. One person who has done so, in print, is John Cook, the lead author of the article. John Cook runs skepticalscience.com, which is a major source for arguments for one side of the global warming dispute, so knowing that he is willing to lie in print about his own work is a reason not to believe things on that site without checking them. [My old blog post giving details]

One of the economists who has been active in estimating consequences of warming is William Nordhaus. He is, among other things, the original source for the 2° limit. A few years ago, he published an article in the New York Review of Books attacking a Wall Street Journal piece that argued that climate was not a catastrophic threat that required an immediate response. In it, he gave his figure for the cost of waiting fifty years instead of taking the optimal steps now—$4.1 trillion dollars—and commented that “Wars have been started over smaller sums.” What he did not mention was that that sum, spread out over the rest of the century and the entire world, came to about one twentieth of one percent of world GNP. He was attacking the WSJ authors for an argument which his own research, as he reported it, supported.

In a recent Facebook exchange on the consequences of AGW for agriculture, someone linked to an EPA piece on the subject. Reading it carefully, I noticed that the positive effects of warming and CO2 fertilization were facts, with numbers: “The yields for some crops, like wheat and soybeans, could increase by 30% or more under a doubling of CO2 concentrations. The yields for other crops, such as corn, exhibit a much smaller response (less than 10% increase).” The negative effects were vague and speculative: “some factors may counteract these potential increases in yield. For example, if temperature exceeds a crop's optimal level or if sufficient water and nutrients are not available, yield increases may be reduced or reversed.” The same pattern held through the article.

A careful reader might also notice that the piece referred to the negative effects of extreme weather without any attempt to distinguish between extreme weather that AGW made more likely (hot summers), less likely (cold winters), or would have an uncertain effect on (droughts, floods, hurricanes). It was reasonably clear that the article was designed to make it sound as though the effects of AGW would be negative without offering any good reason to believe it was true. One telling sentence: “Overall, climate change could make it more difficult to grow crops, raise animals, and catch fish in the same ways and same places as we have done in the past.” With most of a century to adjust, it is quite unlikely that farmers will continue to do everything in the same ways and the same places as in the past.

These are three examples of arguments for one side of the climate controversy by a source taken seriously by supporters of that side. Each can be evaluated on internal evidence, what it itself says, without requiring any expert knowledge of the subject. In each case, doing so gives you good reasons not to trust either the source or the conclusion.

Readers may reasonably suspect that I too am biased. But nothing I have said here depends on your trusting me. In each case, you can look at the evidence and evaluate it for yourself. And all of it is evidence provided by the people whose work I am criticizing.

Monday, June 09, 2014

Global Warming and Wishful Thinking

Political beliefs affect what one wants to be true. People are pretty good at persuading themselves that what they want to be true is true.

That works in both directions in the context of arguments about climate change. People who share my political views are suspicious of government regulation, CAGW (Catastrophic Anthropogenic Global Warming) provides an argument in favor of more government regulation and is used as such an argument at present, so we naturally want to look for arguments against CAGW.

On the other side, it's my experience that people who think global warming is a terrible problem that must be dealt with are also, by some odd coincidence, people who think the things that need to be done to deal with it are things most of which ought to be done anyway, that the real cost is low or negative. They are likely to put that point in terms of creating a cleaner, more sustainable world. From their standpoint, CAGW provides arguments to persuade people to do things they want done, so they naturally want to look for arguments in favor of CAGW.

There is no logical reason why there could not be people out there who believe that a forced shift away from fossil fuels has very large human costs, that by raising the cost of energy it will slow or stop the process by which several billion people are finally escaping from poverty, but think the cost of not doing it is even worse. But despite participating in quite a lot of online climate arguments, I do not think I have encountered a single person  who takes that position.

[I specify CAGW rather than AGW because the argument for action to hold down CO2 emissions requires not only that the globe is warming because of human action but that the net effect of that warming will be negative and large. Also because my own view is that global temperatures have trended up over the past century, that at least part of the reason is probably CO2 produced  by human action, but that there is no good reason to expect the consequences to be negative and large—for details see my old post on the subject and related posts. Hence I believe in AGW but not in CAGW.]

Friday, December 18, 2015

How To Lie While Telling the Truth: Part II

My previous example was an attack on religion. This time it is a defense of AGW catastrophism.

It has long been known that increasing the concentration of CO2 increases the yield of C3 plants, including most crop species. The usual estimate is that doubling CO2 concentration, roughly what is projected for the end of this century, increases yield by 30% or more. This is an inconvenient fact for people who want to argue that AGW will reduce food supplies. Clearly what they need is a scientific article to cite, proving that CO2 is actually a bad thing for crops. 

And they have one, in Nature no less: Increasing CO2 threatens human nutrition.

 The article itself is behind a pay wall, but a good deal of its content is revealed in the abstract and various admiring news stories, including this one:


A quick google found the following table of minerals for wheat:

It includes ten minerals, zinc and iron among them. The fact that the authors of the article could find two whose concentration went down, not by very much, is interpreted as a threat to human nutrition. No information on any that went up.

It's worse than that. The figures, at least according to the news story and the abstract of the article, are for concentration. Increasing CO2 increases the yield of C3 crops. If the concentration of zinc goes down by nine percent but the total crop yield goes up by more than nine percent, total yield of zinc goes up, not down.

Further, the abstract makes it clear that the effect varies from one cultivar to another—so if there really is a problem with the concentration of zinc and iron, farmers will have an incentive to switch to cultivars for which there isn't.

If, with a doubling of CO2 (the abstract does not say what concentration was used in the experiments), crop yield goes up by 30% but the concentration of two minerals goes slightly down and the yield of protein only increases by 24%, that is a "threat to human nutrition."

A striking example of propaganda disguised as science.

-----

[I have sent a message to the lead author of the article inviting him to respond here]

---

Another paper, not behind a pay wall, by many of the same authors. It makes it explicit that "we believe the simplest approach is to model diets that are unchanged with respect to calories and composition."

Sunday, April 13, 2014

AGW, Considered as a Black Swan

In my previous post I took issue with Lovejoy's claim to show, by statistical analysis of global temperature data since 1500, that the probability that natural processes would produce the amount of warming observed in the period 1880 to 2008 was less, probably much less, than one in a hundred. My complaint was not with his conclusion, which might well be true, but with his argument.

In order to calculate the probability that what happened would happen as a result of natural causes of temperature change, Lovejoy needed a probability distribution showing what the probability was of a natural cause producing any given temperature change. He could estimate that distribution by looking at changes over the period from 1500 to 1880 on the (plausible) assumption that humans had little effect on global temperature over that period. But that data could not tell him the probability distribution for events rare enough to be unlikely to show up in his data, for instance some cause of warming that occurred with an annual probability of only .001.

His solution to that problem was to assume a probability distribution, more precisely a range of possible distributions, fit it with the data he had and deduce from it the probability of the rare large events that might have provided a natural cause for 20th century warming. That makes sense if those events are a result of the same processes as the more frequent events, just less likely versions of them—just as flipping a coin and getting eight heads in a row is a result of the same processes that give you four, five, or six heads in a row. But it makes no sense if there are rare large events that are produced by some entirely different process, one whose probability the observed events tell us nothing about—if, for instance, you got four heads in a row by sheer luck, forty heads in a row because someone had slipped you a two headed coin. The forty heads, or the hypothetical rare cause of large warming, would be a black swan, an event sufficiently rare that it had not been observed and so was left out of the calculation.

It occurred to me, after considering a response by Lovejoy and a comment on the Google+ version of my post, that not only was such a black swan event possible in the context of climate, one had occurred. AGW itself is a black swan, a cause of rapid warming whose probability cannot be deduced by looking at the distribution of climate change from the period 1500 to 1880.

If the point is not clear, imagine that Lovejoy wrote his article in 1880. Since warming due to human activity had not yet occurred, there would be no reason for him to distinguish between causes of warming and natural causes of warming. He would interpret the results of his calculations as showing that the probability of warming by a degree C over the next 128 years was less, probably much less, than .01. He would be assuming away the possibility of some cause of substantial warming independent of the causes of past warming, one whose probability could not be predicted from their probability distribution.

That cause being, of course, greenhouse gases produced by human action.


Tuesday, February 25, 2014

Air and Sea: A Very Simple Model

Thinking about recent arguments on climate, I have been trying to work out the logic of the air/sea interaction in order to make sense of the pattern of warming. My current conclusion is that, on a very simple model, what we observe is qualitatively about what we would expect if at some point around the year 2000 net energy input to the system had for some reason declined. The purpose of this post is to sketch the argument and see if people commenting see anything wrong with it.

My model is a very simple one. The whole atmospheric system is one object with uniform temperature, the sea  another object with uniform temperature. The atmosphere gains heat via net radiation input from the sun, loses it via conduction to the sea. At any instant the temperature of the atmosphere is atmospheric heat/atmospheric heat capacity, and similarly for the sea.

If atmospheric temperature were constant for a sufficiently long time the two temperatures would approach equality, but atmospheric temperature has been rising due to net energy input from the sun. Heat loss to the sea by conduction is proportional to the temperature difference between atmosphere and sea. If the net input from the sun had been constant  for a sufficiently long time, the equilibrium of the system would be a constant temperature difference between atmosphere and sea. That gives a constant net heat increase for the atmosphere (radiation in, conduction out) and for the sea (conduction in). Atmosphere and sea are warming at the same rate because if atmosphere warmed faster the temperature difference would be increasing which would increase heat flow from atmosphere to sea which would decrease the rate of warming of the atmosphere, increase that of the sea, until the two equalized. I am ignoring the fact that as the whole system warmed it would radiate more out to space. For simplicity I assume that that effect is small over the range of temperatures I will be looking at, so we can assume constant net radiative input. I am ignoring the fact that if the process went on long enough the sea would boil. I'm looking at much shorter time period than that—decades not millenia.

Now assume that something changes, reducing net radiative input just enough so that heat coming into the atmosphere via radiation is just equal to heat leaving the atmosphere via conduction. The atmosphere stops warming. But it's still warmer than the sea—that's why it is losing heat via conduction. And since it is still losing heat by conduction, the sea continues to warm. Gradually that warming reduces the temperature difference, reducing the rate of heat transfer from atmosphere to sea, slowing the rate at which the sea is warming. If net radiative input remains constant, atmospheric temperatures will gradually start to go up again. If, on the other hand, net radiative input from the sun declines at the same rate at which heat transfer by conduction is declining, atmospheric temperature will remain constant, sea temperature will continue to rise but at a declining rate. 

Figure 1 is a graph of atmospheric temperature taken from skepticalscience, a pro-warming site (i.e. one that argues that AGW exists and is a very serious problem that needs to be dealt with):
Figure 1

eyeballing it, temperatures appear to flatten out sometime between 1998 and 2002 and remain roughly constant thereafter.

Figure 2 is the same graph of ocean heat that I discussed in a previous post.

Figure 2

Eyeballing it, the rate of warming appears to decline about 2003.

This is a very simple model and a very simple description of the graphs. Since both graphs have a lot of noise, a simple description may be the best we can do. As should be obvious, my point is only qualitative. I have not made any calculation of how large the heat flow should be from atmosphere to sea as a function of temperature difference and I have not offered data on the actual size of the temperature difference over time. 

All of that would require a much more elaborate analysis. My point is only that the observed pattern of atmospheric temperature going flat followed by ocean warming slowing but not stopping is the pattern one would expect if net radiative input dropped. It is thus consistent with the idea of a pause in warming, not in the sense of temperature increase of the whole system going to zero—the sea is still warming—but of the temperature increase of the system slowing in the way to be expected if atmospheric warming stopped.

Two questions for commenters:

1. Have I made any mistake in my analysis of the simple model? The only problem I see is that the drop in rate of warming on Figure 2 looks too abrupt—on my model it ought to be a gradual change. But it's a noisy graph.

2. Are there obvious ways in which making the model more realistic would change the conclusion? In particular, are there obvious improvements which would justify the claim, discussed in my earlier post, that there is no pause because the "missing heat" is going into the ocean? I take that as meaning that what has changed is not the net radiative input from the sun but the conductive loss to the sea, that the flattening of atmospheric temperature is due to an increase in the latter not a decrease in the former.

---

P.S. A couple of people commenting on this (one on G+) argue that I have the heat flow backwards, that the input from the sun mostly goes to the land and sea and is then transferred up to the atmosphere rather than going in the other direction as in my model. I have not yet figured out the implications for making sense of the data, assuming they are correct.

Saturday, September 10, 2016

Future Climate and the Food Supply

I recently had an experience both rare and pleasant, a civil and informative argument about climate on FaceBook. It was started by
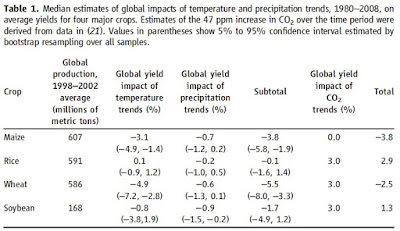
One of the commenters, although not prepared to defend the hysterical tone of the posted piece, was willing to argue that climate change was making the global food situation worse and threatened to make it much worse in the future. In defense of that claim, he cited "one recent study showing four major global crops declining (relative to no climate change)." The article, "Climate Trends and Global Crop Production Since 1980"  (Lobell et. al. 2011), was an attempt to separate out the effects on four major crops of different environmental changes–temperature, precipitation, and CO2 concentration–occurring from 1980 to 2008.

Reading it, I noticed that what the authors defined as the effect of climate change included temperature and precipitation but not CO2; its (positive) effect was listed separately. Including it changed the conclusion from four crops down to two down, two up. The commenter who offered the article as evidence had apparently missed that fact.

I also noticed that while they found a significant warming trend over the period, the trend in precipitation was statistically insignificant – consistent with random change. Redoing the calculation using only the two effects we knew were associated with AGW, warming and increased CO2 concentration, made the percentage increase in rice equal to the decrease in maize, the increase in soybeans larger than the decrease in wheat. The figures are shown in Table 1 from the article.

The table showed no effect of increased CO2 on the yield of Maize. Maize, as the gentleman I was arguing with pointed out, is a C4 crop, the other crops C3, the difference being in the details of the mechanism for photosynthesis. The effect of CO2 fertilization on C4 crops is substantially less than on C3 crops but not zero. Looking at another article that had been linked in the discussion, this one from the EPA, I found:
The yields for some crops, like wheat and soybeans, could increase by 30% or more under a doubling of CO2 concentrations. The yields for other crops, such as corn, exhibit a much smaller response (less than 10% increase).
That suggests that the effect is less than a third as large as the effect on the C3 crops but still substantial. Including it on Table 1 makes the negative net effect on maize smaller than the positive effect on rice.

Looking at the EPA article I noticed that the increase in  yield due to CO2 fertilization was presented as a fact, various things that might decrease yields as possibilities.
"if temperature exceeds a crop's optimal level or if sufficient water and nutrients are not available, yield increases may be reduced or reversed." 
"Extreme events, especially floods and droughts, can harm crops and reduce yields."
 No evidence was offered that any of those things would happen or how large the effects would be if they did. It looked as though the authors wanted to give the impression that climate change would reduce agricultural yields but prudently stopped short of saying so.

I also noticed:
"Overall, climate change could make it more difficult to grow crops, raise animals, and catch fish in the same ways and same places as we have done in the past."
As conditions change, people change what they do in response. If temperatures rise, farmers will shift to crop varieties suited to a warmer environment. If rainfall increases or decreases, they will adjust crop varieties, irrigation, other details accordingly. What would happen if farmers ignored environmental changes in deciding how to farm tells us very little about what will happen in the real world. Whether or not we have global warming, it is quite unlikely that, a century from now, people will grow crops, raise animals, and catch fish in the same ways and the same places as they do now.

The same issue is relevant to the other article. The authors estimated the effect of increased temperature on yield by looking at how yields had varied with temperature, year by year, in the past. Those estimates were  used to calculate the effect of the overall increase in temperature over the period and suggest possible effects of future increases.

To see the problem with that approach, consider a farmer at planting time. He does not know how hot the year will be, how much rainfall there will be. Decisions such as when to plant and what varieties to plant can only be based on the expected value of those variables.

A farmer in 2100 knows what changes in climate have occurred over the previous century so  can take account of those changes in how he farms. It follows that models based on observations of year to year variation will show a more negative effect of climate change than can be expected from gradual change over a long period of time. The authors of the article noted that problem along with other limitations to their analysis.

Most of the time, all I learn from arguing climate with people on FaceBook is how unreasonable most people engaged in the argument, on both sides, are. This was a pleasant change. 


I will have to wait to see whether my opponent has become less confident that climate change threatens the global food supply now that he knows that the article that he thought supported that claim is, if anything, mild evidence against it.

Sunday, March 23, 2014

John Cook's Response to My Criticism

Looking down the comment section of another blog, I have just discovered a response by John Cook to my criticism. He writes:
As lead author of the Cook et al consensus paper, I can demonstrate how David Friendman ginned up a false contradiction by quoting me out of context. Here is the full line from the Bedford & Cook paper:
Of the 4,014 abstracts that expressed a position on the issue of human-induced climate change, Cook et al. (2013) found that over 97 % endorsed the view that the Earth is warming up and human emissions of greenhouse gases are the main cause.
To generate the 'contradiction', Friedman omits the first portion of the sentence:
Cook et al. (2013) found that over 97 % endorsed the view that the Earth is warming up and human emissions of greenhouse gases are the main cause.
I agree entirely with the OP's assertion of checking what writers say and see what their statements are based on. In this case, Friedman's criticism is based on misrepresentation of my original text. I find it extraordinary that Friedman accuses me of a deliberate lie while misquoting my work (deliberately? You decide). It is also ironic that a theme of this post is checking writing for falsehoods while uncritically repeating his misrepresentation.
That would be a legitimate response if my criticism had been of the fact that his 97% figure ignored the roughly two-thirds of papers that took no position on AGW. But, as anyone reading this can easily check from my earlier post, that is not what I objected to. My objection was that the 97% figure lumped together categories 1-3, when only category 1 fitted Cook's "main cause." Categories 2 and 3 were papers saying or implying that human action was a cause—"contributed to" in the language of the example. Category 1 contained 64 papers, or 1.6%, not 97%.

So Cook has indignantly responded to a criticism I did not make, ignored the criticism I did make, and offered a defense entirely irrelevant to the criticism I made.

Which leaves me with a puzzle—is he a rogue or a fool? Is he trying to mislead careless readers who, by the time they have gotten to his response, have forgotten what my criticism was? Or is he so incapable of reading and understanding criticism that he confused the point about the two thirds who expressed no opinion, raised by David Henderson in his piece commenting on mine, with my argument—which David Henderson accurately reported? Is he somehow unaware of the trick he himself pulled by pooling the three categories and reporting only the sum? It seems hard to believe.

One piece of evidence in favor of the rogue theory is that he did not post his response here, as one comment following his suggested. On the other hand, one piece of evidence in favor of the alternative is that he offered a transparently fraudulent rebuttal to my argument instead of remaining prudently silent.

Which suggests that he thought his response was a legitimate one.


Sunday, September 20, 2015

An Explanation for the Pattern of Warming

I have been arguing for some time that what the pattern of global warming suggests is a rising trend due to AGW with an alternating trend from some other cause superimposed on it, the latter having a period of about sixty years. On that interpretation, the period of stable to slightly falling temperatures from about 1940 to 1970 and the period of roughly stable temperatures from 2002 on represent periods when the two trends were pushing in opposite directions and so roughly canceling each other, the rapid warming from about 1910 to 1940 and 1970 to 2002 periods when they were reinforcing each other.


The conventional explanation for the mid-century pause is that it was due to aerosols producing a temporary cooling effect. That became less plausible, at least to me, when the pause reappeared, roughly on schedule. If I am correct, the IPCC models, by special casing the earlier pause instead of treating it as part of a recurring pattern, overestimated the average rate of warming, treating periods when the two trends reinforced as if they were the norm, the period when they canceled as a special case.

I have now come across an article in the Proceedings of the National Academy of Sciences that supports my interpretation of the pattern, based on analysis of the 353 year Central England Temperature Series, the longest instrumental temperature record that exists. The authors conclude that there is a recurrent multidecadal oscillation with a period of about seventy years, likely due to the Atlantic Multidecadal Oscillation. They reject the aerosol explanation and conclude that:
The underlying net anthropogenic warming rate in the industrial era is found to have been steady since 1910 at 0.07–0.08 °C/decade, with superimposed AMO-related ups and downs that included the early 20th century warming, the cooling of the 1960s and 1970s, the accelerated warming of the 1980s and 1990s, and the recent slowing of the warming rates.
Almost precisely my conjecture—I slightly underestimated the period of the oscillation—with an explanation and a lot more data.


Saturday, March 15, 2014

Contra Nordhaus

A recent piece by William Nordhaus purports to show why global warming skeptics are wrong. As he notes, one problem with the project is that there are a lot of people skeptical of different parts of the argument for doing something about global warming. He therefor chooses to select a specific set of criticisms, published in the Wall Street Journal. He writes:
The first claim is that the planet is not warming. More precisely, “Perhaps the most inconvenient fact is the lack of global warming for well over 10 years now.”
In response he offers a graph of global temperature and writes: "We do not need any complicated statistical analysis to see that temperatures are rising, and furthermore that they are higher in the last decade than they were in earlier decades"

We do not need any complicated analysis to see that temperatures have risen over the period 1900 to the present—but the piece he is attacking doesn't say they didn't. It says that they have not been rising for more than ten years—which, so far as one can tell from the graph, is true.  He is attacking them for the offense of making a true claim on the grounds that a claim they did not make is false. 

It is no doubt true that, among those critical of AGW, there are at least a few who deny that warming has occurred at all. But Nordhaus has explicitly limited himself to the claims in a particular article, and that is not one of them.

He goes on to criticize the WSJ article's attack on the IPCC models—specifically, its claim that "computer models have greatly exaggerated how much warming additional CO2 can cause." Unfortunately, his rebuttal never responds to that criticism. 

He writes, for all I know correctly, that "the projections of climate models are consistent with recorded temperature trends over recent decades only if human impacts are included." That is a statement about the ability of models to fit past data, not about whether models fitted to past data did or did not successfully predict temperatures thereafter. The distinction between the ability of a theory to fit past data and its ability to predict data not used in building it is something one would expect an economist to be familiar with.

He next responds to the article's attack on the description of CO2 as a pollutant, writing:
In economics, a pollutant is a form of negative externality—that is, a byproduct of economic activity that causes damages to innocent bystanders. The question here is whether emissions of CO2 and other greenhouse gases will cause net damages, now and in the future. This question has been studied extensively. The most recent thorough survey by the leading scholar in this field, Richard Tol, finds a wide range of damages, particularly if warming is greater than 2 degrees Centigrade. Major areas of concern are sea-level rise, more intense hurricanes, losses of species and ecosystems, acidification of the oceans, as well as threats to the natural and cultural heritage of the planet.
The critical point here is the concept of net damages. That CO2 increase causes damages is not sufficient to make it a pollutant in the economic sense, since it also produces benefits. Neither Nordhaus, Tol, nor I  knows what the sign of the sum is, since it depends on unknown future events. As Nordhaus and others have made clear, negative effects become more serious at higher temperatures. The IPCC projections include a range of temperatures, over some of which net effects might well be positive. I have linked in the past to a piece by Chris Landsea suggesting that a very small increase in force of hurricanes will be combined with a somewhat larger decrease in frequency, in which case that effect also might be positive. I have discussed in past posts here other positive effects and my reasons for thinking that they might well outweigh the negative at levels of temperature increase suggested by the IPCC models.

Nordhaus goes on to make some arguments about the controversy itself—that it is not biased in various ways against skeptics—that I find neither convincing nor terribly interesting. 

His final, and possibly most important point, is based on his own research, which he complains that the WSJ article is misrepresenting. He starts with a correct point—that it is the difference between benefit and cost, not the ratio, that matters. He goes on to summarize his conclusion:
My research shows that there are indeed substantial net benefits from acting now rather than waiting fifty years. A look at Table 5-1 in my study A Question of Balance (2008) shows that the cost of waiting fifty years to begin reducing CO2 emissions is $2.3 trillion in 2005 prices. If we bring that number to today’s economy and prices, the loss from waiting is $4.1 trillion. Wars have been started over smaller sums.
 What he does not mention is that his $4.1 trillion is a cost summed over the entire globe and the rest of the century. Put in annual terms, that comes to about $48 billion a year, a  less impressive number. Current world GNP is about $85 trillion/year. So the annual net cost of waiting, on Nordhaus's own numbers, is about one twentieth of one percent of world GNP. Not precisely a catastrophe. 

I suggest a simple experiment. Let Nordhaus write a piece explicitly arguing that the net cost of waiting is about .06% of world GNP and see whether it is more popular with the supporters or the critics of his position. I predict that at least one supporter will accuse him of having sold out to big oil.

That aside, is his conclusion that we ought to have a carbon tax correct? In a world of certainty run by benevolent philosopher kings, the fact that a policy has even a relatively modest benefit is a good argument for it, but we do not live in such a world. In practice, policies aimed at reducing warming will be designed not by William Nordhaus but by political actors subject to political incentives. For a sample of what that is likely to produce, I suggest looking at the cap and trade bill that passed the House a few years ago but did not make it through the Senate. The farther the policies are from optimal, the higher the costs and the lower the net benefits.

Even aside from that very serious problem, we do not live in a world of certainty. Fifty years from now it may turn out that warming has been much less than the IPCC projected due to technological changes that lower the cost of solar or nuclear power below that of power from fossil fuels, sharply reducing CO2 output. It may turn out that warming has followed the projected path, but costs have not—that the increased droughts, hurricanes, etc. have not appeared. It may turn out that benefits from longer growing seasons, milder winters, CO2 fertilization of agriculture, expansion northward of habitable land area, turn out to be larger than in Nordhaus's calculations. It may turn out that progress in other technologies has provided us with easy and inexpensive ways of modifying either the CO2 content of the atmosphere or global temperature. 

The future is very much too uncertain to have confidence in estimates of what will be happening fifty years from now—for an extended demonstration, see my Future Imperfect. If we follow Nordhaus's current advice and tax carbon now in order to slow warming, it may turn out that the costs were unnecessary or even counterproductive. We may be spending money in order to make ourselves poorer, not richer.

I conclude, on the basis of Nordhaus's own figures and without taking account of my past criticism of his calculations, that he has his conclusion backwards. The sensible strategy is to take no actions whose justification depends on the belief that increased CO2 produces large net costs until we have considerably  better reason than we now do to believe it.

P.S. Bob Murphy raised the question of why I assumed that Nordhaus was giving the cost summed over the rest of the century rather than some other period. After looking through Nordhaus' webbed manuscript and a spreadsheet of his model that he sent me in response to a query by email, I think Bob is correct and I was mistaken. As best I can tell, Nordhaus is running his calculations out to 2305.

If so, that has two implications. 

First, I was too generous in my calculation of annual cost—I should have divided by 291 instead of by 86, reducing the annual cost, in 2012 present value, to about .02% of current world GNP.

Second, Nordhaus writes in his manuscript: "At the same time, we must emphasize that, based on our formal analysis of uncertainty, we have relatively little confidence in our projections beyond 2050." So it looks as though the great majority of the cost he reports is from a period for which he has little confidence in his calculations. Something he did not mention in the NY Review of Books piece I have been commenting on.

A later post on the  same topic.


Tuesday, June 09, 2015

Looking for an Honest Man

I believe I have shown that John Cook, lead author of the article commonly cited for the claim that 97% of climate scientists support AGW, has lied in print about his own work. My argument assumed that Cook et. al. 2013 was itself honest, but other people have offered good evidence that it is not.

It is not surprising if there are some dishonest people on one side, or the other, or both of the climate controversy. A more interesting question is whether there are any honest people. Can anyone point at a prominent supporter of action to prevent warming who has publicly rejected Cook et. al. 2013 or its author?

The same question can be asked of the other side. Are there prominent articles criticizing the campaign to prevent warming that are clearly dishonest, clearly enough so that someone with no commitment to either side of the controversy would recognize them as such? If so, have they been publicly rejected by anyone on that side?

Monday, February 02, 2015

Better than Facebook

For many years I spent a lot of time in conversation and argument on various Usenet groups. Eventually Usenet began to fade, with groups losing members and activity, and I shifted much of my online interaction to Facebook and G+. 

Facebook has an enormous population and a lot of different interest groups represented, but the average quality of the conversation, in my experience, is pretty low. That became particularly clear in climate arguments, where most people on both sides were more interested in cheering for their team and badmouthing the opposition than in understanding the arguments, science and evidence. One illustration was an error that I discussed in an earlier post. Someone posted a link to a video of an experiment that supposedly proved that CO2 was a greenhouse gas. Believers in AGW supported it, critics attacked it, and almost nobody realized that the experiment, even if done perfectly, did not support the conclusion—because almost nobody, in a discussion centered on global warming, understood how the greenhouse effect works (for details see my earlier post).

Not all of Facebook is that bad, of course. The SCA groups contain a good deal of interest and a higher ratio of light to heat. And if one finds someone who is both reasonable and an active poster, friending him and following his posts can be worth doing—although even then the quality is pretty variable.

I think I have now found a better venue for online argument and conversation. I mentioned in an earlier post a blog, Slate Star Codex, by an unusually able, energetic and fair minded poster. It turns out that not only does he write interesting essays, he also attracts a pretty high quality of commenters, making the comment threads interesting conversations, sometimes interesting arguments. Once it occurred to me to read the latest essay, for which the comment thread was still open, instead of whichever old essay looked most interesting, I had a brand new way of interacting with interesting people online.

Not only does Scott write interesting essays and attract interesting people, some of them write interesting essays as well, as I discovered by following a link in a comment thread to this one.

Sunday, November 29, 2015

Trudeau and Putin: Ideology vs Interest

Warmth is, on the whole, a good thing when you are cold, a bad thing when you are hot. Generalizing to nations, the countries most likely to benefit by global warming are ones close to the poles. The habitable area of Canada, for example, is a narrow strip several thousand miles long bordered by the United States on one side, snow and ice on the other. A few degrees of warming would make it substantially wider, as well as making the currently inhabited parts a little more habitable. 

Along similar lines, the countries most likely to lose by global warming are those where it is already too hot. India, for example. Which is why I was struck by a news story about the Prime Minister of Canada's plans to lecture the Prime Minister of India on the dangers of global warming.

Meanwhile, Putin has announced that he does not believe in AGW. My guess is that what that really means is that he is in favor of it. Russia is, after all, the only country in the world with a longer arctic boundary than Canada.

(Very low lying countries are also at risk from warming, but there are not many low enough to be seriously threatened by a meter of sea level rise, which is the upper bound of the current IPCC high emissions projection for 2100.)

Wednesday, November 12, 2014

Implications of Academic Dishonesty

There has been a recent flap over the appearance online of a video of Jonathan Gruber telling the truth about the Obamacare bill:
This bill was written in a tortured way to make sure CBO did not score the mandate as taxes. If [Congressional Budget Office] scored the mandate as taxes, the bill dies. Okay, so it’s written to do that. In terms of risk-rated subsidies, if you had a law which said that healthy people are going to pay in -– you made explicit that healthy people pay in and sick people get money — it would not have passed… Lack of transparency is a huge political advantage. And basically, call it the stupidity of the American voter, or whatever, but basically that was really, really critical for the thing to pass. And it’s the second-best argument. Look, I wish Mark was right that we could make it all transparent, but I’d rather have this law than not.
What he is saying, pretty clearly, is that he wishes one could both be honest and get good legislation passed but approves of dishonesty if necessary to get the job done. 

My guess is that his view is shared not only by most politicians but by most academics involved in the political system, although I expect many would be unwilling to say so, especially on camera. Part of the reason I believe that is an experience that happened almost fifty years ago. I was spending a summer in Washington as a congressional intern. My congressman lent me for four days a week to the Joint Economic Committee. They lent me to the Project on State and Local Finance of George Washington University, aka the Project on State and Local Finance of the JEC, aka the Project on State and Local Finance of the Governors' Conference. The Project was producing a fact book, a volume to provide the ordinary voter with information on state and local finance. 

I discovered a fact. It was a demographic fact about people already born. It was a fact about future financial requirements for the largest expenditure in state and local budgets. The people running the project refused to include the fact in their factbook, not because they thought it was not true or not important but because it pointed in the wrong direction. Knowing it would make voters less willing to support increases in state and local revenues, which was the opposite of the result they wanted.

The fact itself is one you can easily check. The date was about 1967. For the previous fifteen or so years, as the baby boom came into the school system, the ratio of students to taxpayers had been going up, which meant that taxes for schools had to increase in order to keep per pupil spending from falling. For the next decade or two, as the baby boom came out of the schools and into the labor force, the ratio of students to taxpayers would be going down. That meant that per pupil spending could be kept at its current level while taxes for schools went down. Schooling was and is the largest expenditure of state and local governments.

I had assumed that professional academics, people I liked and respected, were committed to honesty in their professional work. I think of the discovery that they were not as my loss of innocence.

My gut reaction is to disapprove both of what the people I worked with then did—pretending to inform people while deliberately misinforming them—and what Gruber describes and approves of, but I cannot prove that my reaction is justified. Gruber's position is that he is willing to sacrifice one value for another that he thinks more important, and I cannot show that he is wrong. I can, however, point out a danger in the approach. Once academics accept the principle that dishonesty is justified if done for the greater good, their work cannot be trusted on any subject with regard to which they have an incentive to misrepresent it. I offered an example in one of my previous posts.

Consider the relevance for the current climate controversy. No single academic knows enough to base his conclusion solely on his own work and expertise. Each of them is relying on information produced by many others. The economists estimating the net effect of AGW rely on the work of climate scientists predicting the effects on temperature of increased CO2, the work of other climate scientists predicting the effect of increased temperature on rainfall, hurricanes, and other relevant variables, the work of agronomists estimating the effect of changes in CO2 concentration, length of growing season, temperature on agricultural production, the work of statisticians confirming the models of the climate scientists on the basis of their analysis of paleoclimate data, and many others.

What happens if each of those experts feels entitled, even obligated, to lie just a little, to shade his conclusions to strengthen the support they provide for what he believes is the right conclusion? Each of them then interprets the work of all the others as providing more support for that conclusion than it really does. The result might be that they end up biasing their results in support of the wrong conclusion—which each of them believes is right on the basis of the lies of all the others.

That is one of the reasons I am not greatly impressed by the supposed scientific consensus in favor of Catastrophic Anthropogenic Global Warming.

There is a quote usually attributed to Bismarck but apparently due to Saxe:
Laws, like sausages, cease to inspire respect in proportion as we know how they are made.
Science too. At least when it intersects politics.

Sunday, April 13, 2014

Two Problems With the 1% Claim

A number of news stories claim that a recent paper by Lovejoy proves that the probability that the warming of the past century is entirely due to natural causes is less than one percent. I find the conclusion plausible enough, but, so far as I can tell, there is no way that it can be derived in the way Lovejoy is said to have derived it.

The first problem, probably the fault of the reporters not of Lovejoy himself, is the misinterpretation of what the confidence result produced by classical statistics means. If you analyze a body of data and reject the null hypothesis at the .01 level, that means that if the null hypothesis is true, the probability that the evidence against it would be as strong as it is is less than .01—the probability of the evidence conditional on the null hypothesis. That does not imply that the probability that the null hypothesis is true given that the evidence against it is that strong is less than .01—the probability of the null hypothesis conditional on the evidence. The two sound similar but are in fact entirely different. 

My standard example is to imagine that you pull a coin out of your pocket, toss it without inspecting it, and get heads twice. The null hypothesis is that it is a fair coin, the alternative hypothesis that it is a double headed coin. The chance of getting two heads if it is a fair coin is only .25. It does not follow that, after getting two heads, you should conclude that the probability is .75 that the coin is double headed. For previous discussions of this issue see this one in the contest of World of Warcraft and this in the context of DNA analysis of mummies.

The second problem is that, so far as I can tell, there is no way Lovejoy could have calculated the probability that natural processes would produce 20th century warming from the data he was using, which consisted of a reconstruction of world temperature from 1500 to the present. The paper is sufficiently complicated so that I may be misinterpreting it, but I think his procedure went essentially as follows:
Assume that changes in global temperature prior to 1880 were due to random natural causes. Use the data from 1500 to 1875 to estimate the probability distribution of natural variation in global temperature. Given that distribution, calculate the probability that natural variation would produce as much warming from 1880 to 2008 as occurred. That probability is less than .01. Hence reject the assumption that warming from 1880 on was entirely due to natural causes at the .01 level.
The problem with this procedure is that data from 1500 on can only give information on random natural processes whose annual probability is high enough so that their effect can be observed and their probability calculated within that time span. Suppose there is some natural process capable of causing a global temperature rise of one degree C in a century whose annual probability is less than .001. The odds are greater than even that it will not occur even once in Lovejoy's data. Hence he has no way of estimating the probability that such a process exists. The existence of such a process would provide an explanation of 20th century warming that does not involve human action. So he cannot estimate, from his data, how likely it is that natural processes would have produced observed warming, which is what he is claiming to do. 20th century warming would, in that case, be what Taleb refers to as a Black Swan event. If one swan in a thousand is black, the observer looks at five hundred swans, finds all of them white, and concludes, incorrectly, that the probability of a black swan is zero.

How does Lovejoy solve that problem? If I correctly read the paper, the answer is:
Stated succinctly, our statistical hypothesis on the natural variability is that its extreme probabilities ... are bracketed by a modified Gaussian...
In other words, he is simply assuming a shape for the probability distribution of natural events that affect global climate. Given that assumed shape, he can use data on the part of the distribution he does observe to deduce the part he does not observe. But he has no way of testing the hypothesis, since it is a hypothesis about a part of the curve for which he has no data.

If I am correctly reading the paper—readers of this post are welcome to correct me if they think I am not—that means that Lovejoy has not only not proved what reporters think he has, he has not proved what he thinks he has either. A correct description of his result would be that the probability that natural processes would produce observed warming, conditional on his assumption about the shape of the probability distribution for natural processes that affect global temperature, is less than .01.

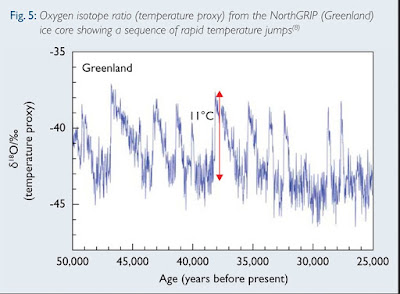
One obvious question is whether this problem matters, whether, on the basis of data other than what went into Lovejoy's paper, one can rule out the possibility of natural events capable of causing rapid warming that occur too infrequently for their probability to be deduced from the past five hundred years of data. I think the answer is that we cannot. The figure below is temperature data deduced from a Greenland ice core. It shows periods of rapid warming, some much more rapid than what we observed in the 20th century, occurring at intervals of several thousand years. During one of them, "The temperature increased by more than 10°C within 40 years." The temperature shown is local not global—we do not have the sort of paleoclimate reconstructions that would be needed to spot similar episodes on a global scale. But the fact that there are natural sources of very rapid local warming with annual frequency below .001 is an argument against ruling out the possibility that such sources exist for global warming as well.


In my next post, I pointed out that not only was it possible that there existed a low probability process capable of producing rapid warming whose cause and hence  probability was independent of the higher probability processes Lovejoy observed, it appears to have actually happened—certainly Lovejoy believes it did. AGW itself is a black swan in precisely the sense discussed above.