My previous post contained a graph of northern hemisphere sea ice from which it seemed clear that the past trend of declining area, rather than continuing as the JPL claimed, had reversed. The first comment on that post claimed that I had cherry picked my data, offering as evidence another graph presenting the information in a different form which, the commenter said, supported the JPL claim.
As I pointed out in my response, his graph did not support the claim either, although it did not contradict it as strikingly as mine did. That raises the question of why two graphs from the same web page presenting the same information looked so different. While it might be possible to answer it by searching out additional information on the web site, I thought it would be more interesting to see what one can figure out simply by looking at the graphs. I will refer to his graph as graph A and mine as graph B. Both are shown below.
As I pointed out in my response, his graph did not support the claim either, although it did not contradict it as strikingly as mine did. That raises the question of why two graphs from the same web page presenting the same information looked so different. While it might be possible to answer it by searching out additional information on the web site, I thought it would be more interesting to see what one can figure out simply by looking at the graphs. I will refer to his graph as graph A and mine as graph B. Both are shown below.


Graph A shows swings within each year over a range of about ten million square kilometers, presumably reflecting expansion and contraction of the area of sea ice with the seasons. The variation in Graph B within each year is much smaller and less regular. Pretty obviously that means that the data in Graph B is seasonally adjusted. The figure for, say, January of 2009 shows how much higher or lower the area of sea ice was than the average for Januaries over the reference period, eliminating the seasonal variation. That fits the title. The graph is showing, not the area, but the anomaly, the difference between the area at that time and its previous average.
That way of drawing the graph makes it easier to see trends, since changes over the years aren't masked by the much larger changes within each year. A more subtle difference is that, looking at graph A, one loses almost all of the relevant data. The month to month difference is so large that one cannot tell by eye whether sea ice area in January of 2008 was more or less than in 2009. All you can see is that sea ice area in the month when it was largest was about the same in 2008 as in 2009, and sea ice area in the month when it was smallest was a little larger in the second year. You are left trying to interpret trends based only on the extremes of the cycle—data from two observations a year instead of about twelve.
Graph B, by eliminating the seasonal effect, gives a much clearer picture. If sea ice area was larger in ten months of the second year than in the corresponding months of the first year and lower in two, that will show as a rising trend with a couple of downticks—even if the low months happened to also be the extremes. What the commenter viewed as noise on Graph B—the shifts up and down month by month—is information, information obscured by the large seasonal variation on Graph A.
[To see the webbed graphs, which are larger and clearer than the images here, click on the Graph A and Graph B links]
 (Later addition)
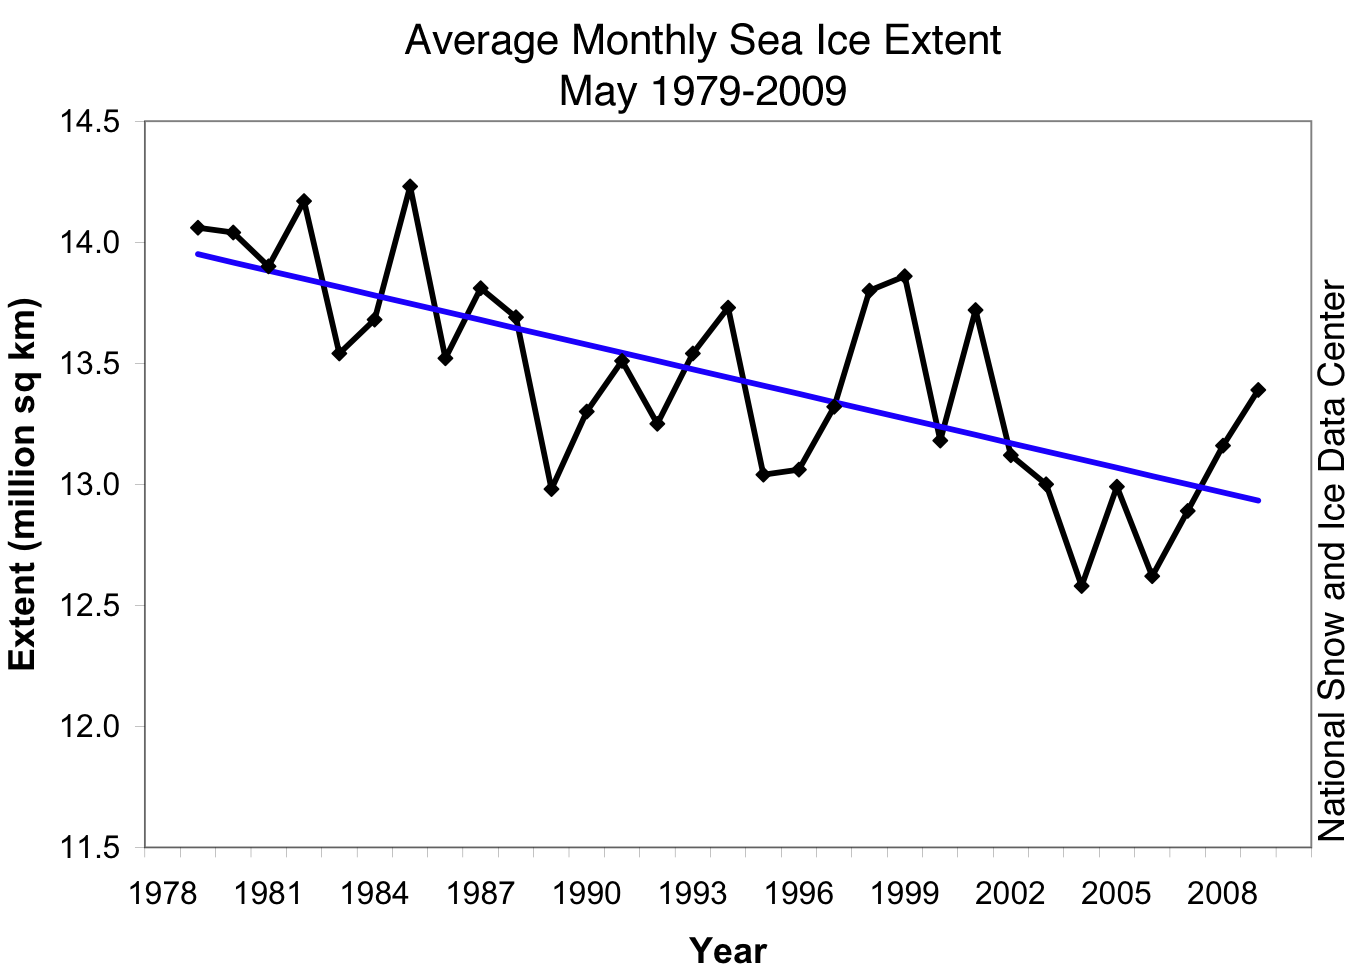
The data from the same source for May are now in. May sea ice extent has risen for the past three years, bringing it back to about its level in the late 1980's early 1990's.
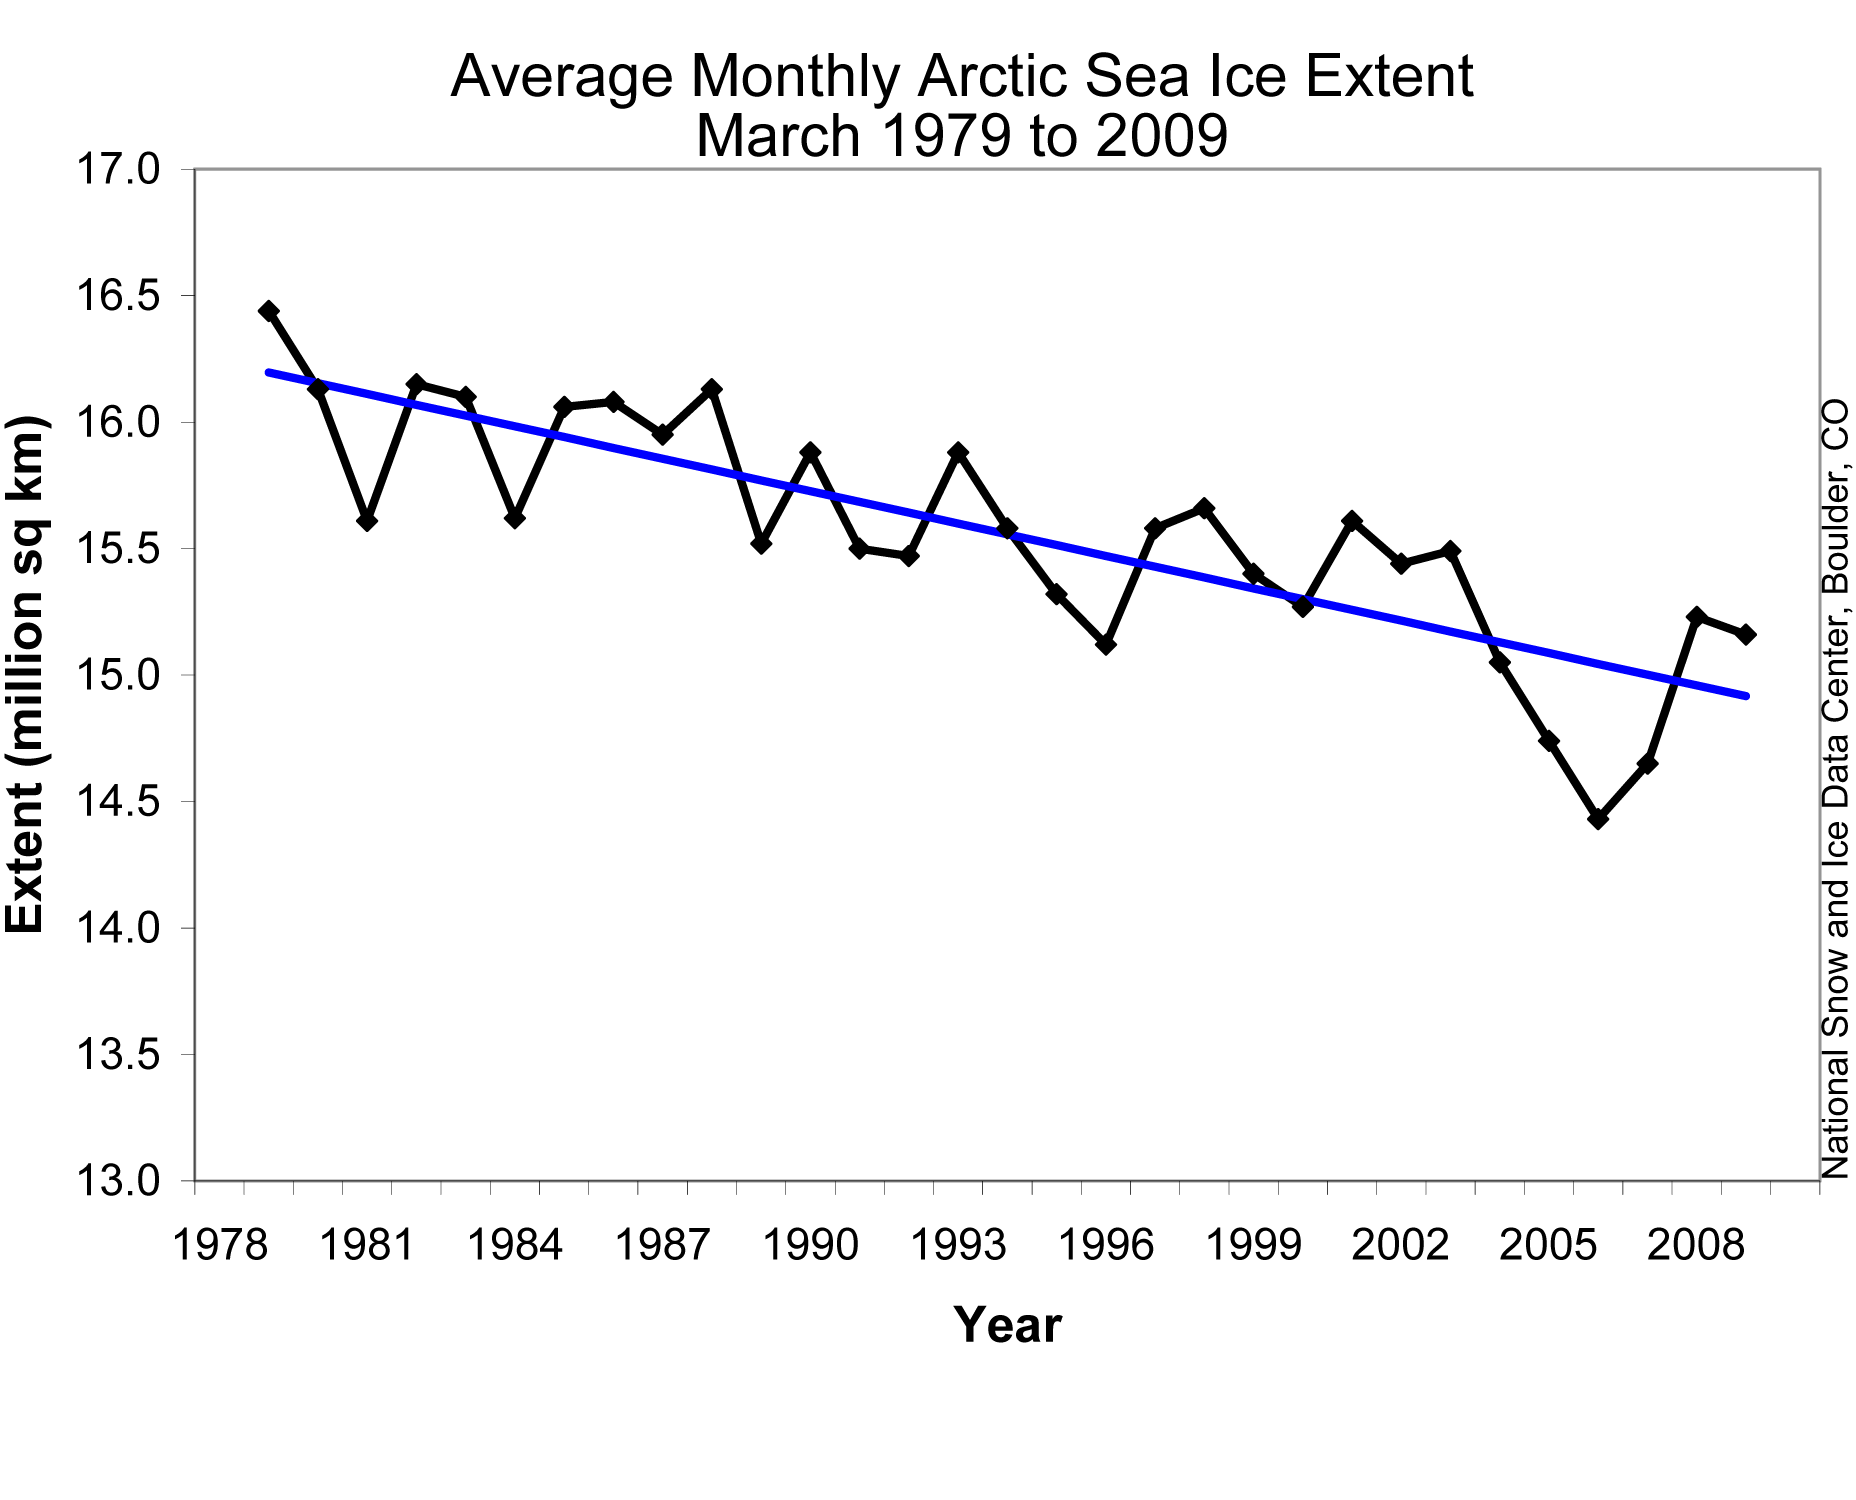
On the other hand, poking around the same source, I found the graph for March, which provides at least a little support for the JPL comment I have been attacking, which was published in April. It shows March sea ice rising a lot for two years, but falling a little in the most recent year. To describe that as "continues to shrink" strikes me as clearly misleading, but it's an exaggeration to describe it as a flat lie.
That way of drawing the graph makes it easier to see trends, since changes over the years aren't masked by the much larger changes within each year. A more subtle difference is that, looking at graph A, one loses almost all of the relevant data. The month to month difference is so large that one cannot tell by eye whether sea ice area in January of 2008 was more or less than in 2009. All you can see is that sea ice area in the month when it was largest was about the same in 2008 as in 2009, and sea ice area in the month when it was smallest was a little larger in the second year. You are left trying to interpret trends based only on the extremes of the cycle—data from two observations a year instead of about twelve.
Graph B, by eliminating the seasonal effect, gives a much clearer picture. If sea ice area was larger in ten months of the second year than in the corresponding months of the first year and lower in two, that will show as a rising trend with a couple of downticks—even if the low months happened to also be the extremes. What the commenter viewed as noise on Graph B—the shifts up and down month by month—is information, information obscured by the large seasonal variation on Graph A.
[To see the webbed graphs, which are larger and clearer than the images here, click on the Graph A and Graph B links]
-----------------------------------------------
As a result of a comment to this post, I found a graph showing April sea ice cover from the National Snow and Ice Data Center, the source that the JPL article cites. Here is the graph. It shows ice extent rising for the past two years.
 (Later addition)
The data from the same source for May are now in. May sea ice extent has risen for the past three years, bringing it back to about its level in the late 1980's early 1990's.
On the other hand, poking around the same source, I found the graph for March, which provides at least a little support for the JPL comment I have been attacking, which was published in April. It shows March sea ice rising a lot for two years, but falling a little in the most recent year. To describe that as "continues to shrink" strikes me as clearly misleading, but it's an exaggeration to describe it as a flat lie.
256 comments:
«Oldest ‹Older 201 – 256 of 256You sure do like to change the subject when you're proven wrong, don't you, "VangelV"?
"The IPCC has been lowering its estimates in each successive report towards the figures that Mocnkton gave."
Really? Given the spacing of IPCC reports, in what year will the IPCC value equal Monckton's?
Given the actual temperature readings, which have diverged from the models by quite a bit, I think that three reports from now the IPCC, if it still exists, will have to admit that temperatures are much cooler and that the AGW hypothesis was false. But as I said, the IPCC estimates keep coming down and are getting closer to the literature that Moncton was referencing. That makes him right and the initial IPCC reports wrong. You could try that it is different with this report but I doubt that anything will change given the problem that the IPCC is having keeping dissenting scientists from exposing its game.
"I am saying that Wegman's network analysis shows a lack of independence Really?"
Given a certain level of specialization, how much "independence" would you expect?
Specialization? What does that have to do with understanding basic statistics? And McIntyre had no trouble reconstructing the Mann methodology after he was denied the information. As I said, even Mann supporters A&W showed that M&M were correct and that the specialist, Mann, was wrong. If a mining analyst can catch the errors and do the math please excuse me if I don't buy into the, 'it is so specialized,' song and dance. And you would figure that an 'expert reviewer' would know enough basic statistics to ask for the R2 value.
"It is clear that the review process at Nature has failed. It is also clear that some journals will not print sound papers because it does not fit their editorial beliefs."
There's that conspiracy thing popping up, as expected.
No, that is the stated opinion under oath of Wegman, who actually believes in AGW even as he rejects the palaeoclimatologist reconstructions as invalid for using proxies not acceptable to the NRC and inadequate statistical methods.
But I don't have a problem with the science that is being published because there is plenty of evidence that the AGW side has lost the debate."
How so? Because the fine folks at CA say so? Because Monckton says so?No. Because the satellites and buoys are showing that the warming trend is over and because the model predictions are off by too much to allow the models to be taken seriously. As I said before, no matter how you try to spin the story the ice core data that your side was hyping shows that temperature changes come firs and are followed by changes in CO2 concentrations after about 800 years.
As time passes, the denialist community is getting more and more shrill, conspiratorial, paranoid, and loses credibility. You're certainly doing your part!It is the other way around. As the public gets wise and starts to pay attention to Lindzen, Christy, Landsea, Gray, Pielke, Shaviv, Svensmark, Pilmer, etc., your side is becoming more shrill and keeps trotting out 'studies' based on model projections instead of real world measurments.
"My preference is to use a court type of system in which both sides of this issue have to make their case and the arguments are open to external review by the public."
Have you really thought this through? What happens to the "losers" in a "trial"?Common law courts have a good way of handling damages. But that is not the most important point. What is important is to look at the real world evidence objectively and to get rid of the irrelevant hype and narratives from both sides. Absent the models and unsupportable assumptions about feedbacks we have to actually go back to real science and actual observations, which is the one thing that the AGW side desperately tries to avoid because it shows no crisis.
"So let me get this straight. If a mathematical equation is given by someone who is not a scientist then we can just ignore it even though it is right? And when the non-scientist comes up with a figure that disputed by a scientist we should choose the scientist[']s answer even though the non-scientist[']s answer is closer to that provided by the IPCC? Why should I accept a wrong answer just because it is given by a scientist?"
You are confusing 'the views of any given individual' with 'the scientific process and its results'. It's not the origin of a claim, but the method by which we accept or reject it as accurate or innacurate to the facts, that determines whether or not it gets to count as scientifically credible. This is how science works. I understand that you don't like it - that you'd prefer "a court type of system" (I mean seriously - what the fuck??) - but that's too bad, basically.
David - a similar thing (views of given individual scientists versus scientific method) applies to your last comment. Of course you can't read a single scientific paper and from that glean the widely accepted conclusions of the field. You could try a meta-analysis, though, or read works that summarise prior research conclusions and controversies. Or you could talk to people who know their stuff. Again, I agree with Andrew that if you have access to Lynn Orr he'd probably be a useful person to chat to - not just on the press release thing, but on more general topics related to the field. But hey, there are plenty of other ways to get yourself informed.
Well, "VangelV", you're doing your best to fulfill the stereotype of the denialists...
As I've said all along - deliberately misstate the science, cherry-pick, make unfounded accusations, issue smears and slurs, refuse to support claims, manipulate the facts to suit an agenda... and so on and so on.
The capper was your idea to put science into the courts - if you thought science was politicized before, your idea magnifies that by orders of magnitude. That has got to be the oddest (to say the least) idea I've ever heard.
You're trapped in your dogma.
Duncan writes:
"Of course you can't read a single scientific paper and from that glean the widely accepted conclusions of the field."
Or two. Or three. It would be a lot of work, for a pretty low degree of confidence. And I'm better qualified to read them than most laymen, since I have a professional level of understanding of two of the relevant fields (economics and physics) and a reasonable understanding of a third (statistics).
"You could try a meta-analysis, though, or read works that summarise prior research conclusions and controversies."
Without knowing more about the field than any layman is likely to do, how do I tell whether the summary is honest and competent? It might be by the equivalent of Galbraith--a good writer with very little in the way of a professional reputation and a considerable axe to grind. And similarly for the meta-analysis.
Remember, this started with my pointing out a flatly false factual assertion from a reputable source.
Speaking of which ... . If you had come across that JPL page, would you have checked it out against the data? It seems to me that in this particular case, I'm the one who has been doing what you are arguing one should do. The more usual pattern, as exemplified by G-Man in this discussion, is to ignore even the clearest evidence when it doesn't fit the pre-existing conclusion.
"Or you could talk to people who know their stuff."
As I mentioned, I tried that once--and concluded that, at that point, the claims for AGW were greatly overstated.
But again, how does the layman in any field figure out who knows his stuff, and who is trustworthy?
This is less of a problem on issues that are less politically/ideologically loaded than the ones I've mentioned. But on those, there are lots of reasons for people in or out of the field to make claims not supported by good evidence.
Somewhere there's a bit by Krugman where he comments on his discovery, talking with people in evolutionary biology, that Gould was the equivalent in that field of Galbraith in his. Yet Gould surely has a larger influence on public views of such matters than, say, Dawkins.
G-Man writes (To Vangel):
"You're trapped in your dogma."
I don't know which of you is more nearly correct in the argument you have been having. But you are the one who, faced with a straightforward example of a false statement on your side of the argument by a reputable source--what this whole series of posts started with--refused to admit it.
It's entirely possible that Vangel is trapped in his dogma. But you are the one who has demonstrated, here, that you are trapped in yours.
As I've stated, I don't consider the JPL statement a "lie", since as long as NH sea ice extent for April is below the April 79-09 mean, it cannot be considered to have *stopped* declining. And, as I've said before, a single data point doesn't define the "reversal" of a trend - that remains to be seen, as additional Aprils occur.
David, you seem to be stuck on the concept that one inflection point determines the overall state of a longer-term trend, which is precisely the problem "VangelV" is having. He's declared global warming over, because of 2008.
That's wrong.
"As I've stated, I don't consider the JPL statement a "lie", since as long as NH sea ice extent for April is below the April 79-09 mean, it cannot be considered to have *stopped* declining."
As I have already pointed out, you are confusing a level with a rate of change. As of the most recent April data, arctic sea ice area is low but rising, not low and falling. We don't know if that will continue to be true--but the JPL statement was about the most recent data, not about the future.
Do you really want to say that the stock market is currently going up--and has been for the past year? It's been above its long term average all year.
A question I asked before--and you didn't answer.
As I already said, if you really don't understand the distinction--in mathematical terms, between a statement about a function and a statement about its derivative--then you are not equipped to form opinions on scientific issues, including this one.
Since when does a single dv/dt being positive mean that a trend is over?
"Since when does a single dv/dt being positive mean that a trend is over?"
It doesn't. It's evidence that the trend is over, but very weak evidence. What it isn't is evidence that the trend is continuing, which was the JPE claim.
Again, the JPE quote:
"The latest Arctic sea ice data from NASA and the National Snow and Ice Data Center show that the decade-long trend of shrinking sea ice cover is continuing."
Not "the latest evidence is not sufficient to conclude that the trend has reversed."
Your claim is that v is below its long term average value. The JPE's claim was that dv/dt is negative in the latest data. You want to pretend that those are equivalent, although you apparently know enough to realize that they are not.
If you disagree, reread your comments on the subject.
Draw a line from 1999's value to 2009's value. Is the slope negative?
David - you wrote:
"the latest evidence shows the trend reversing"
Do you consider this statement to be true? Like G-Man, I believe it to be false.
If it is false, is it a lie?
Duncan writes:
David - you wrote:
"the latest evidence shows the trend reversing"
Do you consider this statement to be true? Like G-Man, I believe it to be false.
If it is false, is it a lie?"More precisely, I wrote:
"when the latest evidence shows the trend reversing--whether briefly or permanently we don't know."
With that addition, the statement is true. The latest evidence shows arctic sea ice has been going up for about a year and a half. That's a reversal of the downward trend. It may be a very brief reversal, of course.
Without the point about "briefly or permanently" I would have said, as I think I did say elsewhere, that the latest evidence is evidence that the trend has reversed, but so far not very strong evidence. That's taking "the trend" to refer to the longer term.
Since you think the statement is false, does that mean you think the latest evidence does not show at least a brief reversal of the trend? How else would you describe data showing a series declining for ten years, then rising for a year and a half?
Since we are talking about "the latest evidence," as of the JPL page, consider in particular the graph I show of April sea ice extent, which has been rising for two years now.
"Draw a line from 1999's value to 2009's value. Is the slope negative?"
Yes. Now draw one from the 2008 value to the 2009 value. What's the slope?
The JPL claim wasn't that the level was still below its long term average, it was that it was continuing to go down. That's what "the trend is continuing" means.
And it isn't true.
Originally:
The latest Arctic sea ice data from NASA and the National Snow and Ice Data Center show that the decade-long trend of shrinking sea ice cover is continuing.Now draw one from the 2008 value to the 2009 value. What's the slope?You don't get to pick the period 2008-2009, because then you're not at a decade, as the above quote from JPL mentions. April 2009 was indeed less (but only a little) than April 2000. The slope 2000-2009 is negative.
"The satellite record is more accurate than the manipulated surface data."
The surface data being "manipulated" when it doesn't show what your ideology demands; otherwise, it's OK. Another instance of your cherry-picking.
We know that GISS adjusts the data because it admits to doing it because the surface stations do not meet the quality standards.
Here is an example showing the changes to the US data.
Here we have James Hansen, Reto Ruedy, Jay Glascoe and Makiko Sato writing that, "The U.S. has warmed during the past century, but the warming hardly exceeds year-to-year variability. Indeed, in the U.S. the warmest decade was the 1930s and the warmest year was 1934." That was written in 1999. Since then the data has been changed and no longer supports the quote.
Here we have a photo of a temperature sensor in Hartington, NE. As Anthony Watt points out, according to the standard the short distance to the concrete patio gives this station a CRN4 rating, which means that there is a bias of 2C or more. (The barbecue is also probably an issue but we do not need to go into that here.) How does GISS deal with the bias? You guessed it, GISS lowers temperatures prior to 1978.
A better example would be Marysville. As the photo shows, the sensor is close to asphalt, a building and air conditioning exhausts. The aerial photo shows a number of structures in the area where the station is located. The structures, asphalt and A/C units were not there 100 years ago and neither has the station because the station has being moved a number of times.
If we look at the temperature record, we see a steady increase for the past 100 years but see that the temperature record for the 1880s shows that temperatures were as warm as today.
But 50 miles away we have the Orland station which has been in the same location for 100 years. If we look at the satellite image we see that the station is far from structures that can bias the readings and is in pretty good shape. The temperature data shows no warming.
So what does GISS do? It has a station that has seen structures grow around it and the introduction of bias such as asphalt surfaces and A/C exhaust that shows a warming trend. It has another station not too far away that has never been moved and has not seen the introduction of artificial sources of heat to bias the readings. That station shows a cooling trend.
Well, you guessed it. The GISS adjusted the Orland data to make the past temperatures cooler.
Tell me again how that is credible?
"It shows no major warming problem even though it begins near the start of the last warming trend after the PDO went into its positive mode. Cherry picking would be to look at only the last 12 years. I do not need to do that to show that there is no warming issue in the entire data set."
You do realize that satellites don't actually detect surface temperature, and that at 30 years, the satellite era is just barely long enough for analysis.I do realize that the satellites don't measure surface temperatures. But they do measure atmospheric temperatures and can tell us what has happened to the atmosphere over the past 30 years.
And yes, we do not have records that are accurate enough to draw certain conclusions because 30 years is not long enough. But the problem is a horrible surface station record that is totally unsuitable for the purposes for which it is being used. The effects of urbanization and other bias are hard to separate because there are no records that show when A/C units were installed near temperature sensors or when barbecue pits or tennis courts were put in close to the weather stations. Absent such information much of the data is fairly useless.
In any case, of those in the skeptic community, you're a denialist, which puts you on the fringe of that minority. When I got into this business, 20+ years ago, your view was more common - "No warming, no problem". Then the skeptic position became "OK, it's warming, but we aren't at fault". Then, even before the IPCC AR4, it became "OK, we're at fault, but it won't be very bad and we can adapt". The skeptics have had to concede that anthropogenic climate change is real - it is they who have lost the debate. Today, they're reduced to drive-by posts in the blogosphere, and snookering the fossil fuel industry for some cash to make their little bleatings and whinings.
I am a libertarian and as such am used to being in the minority. Actually, the scientific ignorance of the majority is of no concern to me. While I would prefer to live in a rational world where governments do not meddle and make stupid decisions I take full advantage of the inevitable stupidity and have become far richer than I could have become if I lived in a rational world.
And please stop trying to rewrite history. The sceptics never claimed that there was no warming after the Little Ice Age ended or that urbanization would not make many temperature stations show large increases over time. Their argument was that the effect of urbanization was clear in the raw data and that the 0.7C of warming since the Little Ice Age was beneficial to people, plants and animals.
You are confusing 'the views of any given individual' with 'the scientific process and its results'. It's not the origin of a claim, but the method by which we accept or reject it as accurate or innacurate to the facts, that determines whether or not it gets to count as scientifically credible. This is how science works. I understand that you don't like it - that you'd prefer "a court type of system" (I mean seriously - what the fuck??) - but that's too bad, basically.
I always thought that the real world observations showed whether a hypothesis was credible. Here is a good example of how the process works. Scientists claim to be able to model the workings of the sun and predict that Solar Cycle 24 will be 30-50% stronger than the previous one and that it should start in late 2007 or early 2008. Well, it is May and we have yet to see the cycle begin. I would say that made the experts very wrong and the sceptics, who did not publish in Geophysical Research Letters, right. It seems very clear that the evidence shows that the scientists didn't really have a clue how the sun works and that many of the people who were suggesting that we were going into another Dalton Minimum type of event may have been much closer to the truth. If those people are right the 12 years of cooling will last until well after 2020 and the whole AGW nonsense will have to be dropped. Of course, I think that fiscal reality will intervene much sooner than that and that once voters figure out where the AGW debate is leading they will demand real proof rather than rhetoric.
Well, "VangelV", you're doing your best to fulfill the stereotype of the denialists...
There goes the D word again. It is you who is denying that the world has not warmed up for more than a decade, that warming is preferable to cooling or that the sun has a big role to play in climate.
As I've said all along - deliberately misstate the science, cherry-pick, make unfounded accusations, issue smears and slurs, refuse to support claims, manipulate the facts to suit an agenda... and so on and so on.
If you don't like the science that is your problem. Frankly, it was your side that started with the ice core hype only to have the improved resolution turn the table and show that temperature change was driving CO2 concentrations just as the solubility curves predict. I never liked the ice core assumptions to begin with but if that is what your side chose to use it is not my fault when the conclusions falsify your claims.
The capper was your idea to put science into the courts - if you thought science was politicized before, your idea magnifies that by orders of magnitude. That has got to be the oddest (to say the least) idea I've ever heard.
Why not? Instead of calling people names you would have to use facts to prove your case. You can't hide behind a false claim of consensus but will have to deal with inconvenient facts and would have to explain how models that can't predict temperatures ten years out are supposed to be trusted about temperatures 100 years from now.
You're trapped in your dogma.
I am sceptical of all dogma. You seem to be a member of the AGW cult.
Or two. Or three. It would be a lot of work, for a pretty low degree of confidence. And I'm better qualified to read them than most laymen, since I have a professional level of understanding of two of the relevant fields (economics and physics) and a reasonable understanding of a third (statistics).
I think that you are more than capable if you were willing to and had the time to put in the work. I'll give you a perfect example. In 1999, Hansen wrote that, "The U.S. has warmed during the past century, but the warming hardly exceeds year-to-year variability. Indeed, in the U.S. the warmest decade was the 1930s and the warmest year was 1934." Well, the data set no longer supports the 1999 statement and you have to ask why the data was changed.
Once you get thinking about that it makes sense to look at where the surface data is coming from and ask if it is reliable.
By doing an hour of two of reading you will realize that much of what is being reported is very questionable because it isn't clear that the data is accurate or useful.
And if you have a little kid around, as I do, you can be the driver in a science experiment to measure the urban heat island effect. You will not need more than a few hours and a few gallons of gas to figure out the large increase of temperatures due to land use changes and the presence of artificial heat sources. When you compare what you get with what the IPCC is claiming even more doubt will enter the picture.
And then there is the math. Sorry David but if the feedback assumptions used by the IPCC models were valid we can't experience long cooling periods while CO2 concentrations were rising. And if there were the energy imbalance that is being claimed the heat would have to show up in the oceans. But we did have long cooling trends as you well know because you are old enough to remember the cooling scare.
Of course the feedback assumptions could be changed to fit the actual observations and to improve predictions. But the IPCC can't do that because with the new feedback assumptions there would be no warming crisis to worry about.
Originally:
The latest Arctic sea ice data from NASA and the National Snow and Ice Data Center show that the decade-long trend of shrinking sea ice cover is continuing.Now draw one from the 2008 value to the 2009 value. What's the slope?You don't get to pick the period 2008-2009, because then you're not at a decade, as the above quote from JPL mentions. April 2009 was indeed less (but only a little) than April 2000. The slope 2000-2009 is negative.
The NSIDC satellite sensors were failing and it is hard to figure out exactly what the true ice cover area was. (That might explain why some areas shown as open water were frozen over.) And given the fact that the ice thickness estimates were off by 100% I don't know how much faith you can put in the system.
Obviously, time hasn't mellowed "VangelV".
All that I've said all along still holds true.
The kicker for me that you don't really know what you're talking about (outside of cutting and pasting from the blogosphere) is when you stated "models that can't predict temperatures ten years out are supposed to be trusted about temperatures 100 years from now.". If you don't know why that's wrong, then there's really no hope for you in truly understanding the subject.
The kicker for me that you don't really know what you're talking about (outside of cutting and pasting from the blogosphere) is when you stated "models that can't predict temperatures ten years out are supposed to be trusted about temperatures 100 years from now.". If you don't know why that's wrong, then there's really no hope for you in truly understanding the subject.
It isn't wrong. The model predictions have proven to be wrong time after time. We now have studies that are showing that the ocean circulation models that are a part of the CGMs are wrong, which make the models themselves useless. The bottom line is that it makes no sense to take actions that will harm the economy based on models that do not reflect reality and have no predictive power.
The bottom line is that it makes no sense to take actions that will harm the economy based on models that do not reflect reality and have no predictive power.You're still wrong. Your views are based on press releases and snippets from the denialist blogosphere.
You still don't understand climate models and how they're used. Until you do, your pronouncements on their utility are worthless.
Thanks David.
I don't want to teach you to suck eggs, as it were, because I know you've got background. But the word or concept 'trend' can't be, and isn't, used this way in statistical or scientific analysis. New data which shows an increase in x, where the long term trend is a decline in x, cannot simply be taken to represent a "reversal of trend". A trend is something that's read off the data - it's visible through fluctuations in data - it is not identical with every movement of that data. When you write "That's a reversal of the downward trend. It may be a very brief reversal, of course" you're identifying the trend with the specific short term movements which make the trend visible - and those specific short term movements are precisely what a trend is not.
I know you know this. But the statement "the latest evidence shows the trend reversing--whether briefly or permanently we don't know" seems confused on the point - and I continue to regard it as false.
"The bottom line is that it makes no sense to take actions that will harm the economy based on models that do not reflect reality and have no predictive power."
You're still wrong. Your views are based on press releases and snippets from the denialist blogosphere.
You still don't understand climate models and how they're used. Until you do, your pronouncements on their utility are worthless.
Actually, I understand well enough what models can and can't do. The bottom line is that when you have such bad predictions you can't make decisions based on those predictions. And when the models have been falsified by observations they have to be rejected.
As I wrote before, yours seems to be a faith based approach.
Like I said, you don't understand climate models.
Perhaps a video will help "VangelV" understand.
Watch it here.
I know you know this. But the statement "the latest evidence shows the trend reversing--whether briefly or permanently we don't know" seems confused on the point - and I continue to regard it as false.
But climate is a dynamic non-linear system and temperature is influenced by a number of cycles of varying length. The AGW people selected the end of the Little Ice Age to suggest that the trend is moving higher and argue that shorter periods cannot be used to falsify their claims. The ice cover argument is very similar because it is also influenced by a number of factors and shows fluctuations that may last longer than the period covered by the satellite record, which didn't even begin until the PDO began its positive phase. The use of such short periods of time to draw any conclusion is meaningless, particularly when we have evidence that the Arctic was warmer and had less ice cover in the past when CO2 could not have been responsible.
Perhaps a video will help "VangelV" understand.LOL. Temperature changes lead CO2 by 800 years. That means that CO2 is driven by temperature changes whether they are caused by Milankovitch orbital variations or some other factor. The bottom line is that CO2 concentration is still the effect and not the cause. Your narrative does not change what the data shows.
"VangelV", Too bad you missed the definition of strawman at the beginning, as well as the following explication of yours.
Look up the papers mentioned, if you don't like "narrative".
Look up the papers mentioned, if you don't like "narrative".I have. They data in the papers show that the temperature change leads changes in CO2 by around 800 years. That means that the cause is the temperature change and the effect is the CO2 change no matter which spin Hansen uses to minimize the effect of Milankovitch cycles.
"VangelV", you still don't get the science.
Re-read the papers again.
"VangelV", you still don't get the science.
Re-read the papers again.Like I said, I get the science and see no objective evidence to support the extreme predictions made by the IPCC and the AGW cult.
As I pointed out before, Arctic temperatures went up from 1910 to 1940, cooled into the 1970s and went back again from the early 1970s to the levels that we see today. But the temperature records show that temperature changes are highly correlated with the Atlantic Multi-decadal Oscillation and that the current warming rates were much lower than those from 1910 to 1940. The AMO has nothing to do with AGW.
Like I said, I get the science and see no objective evidence to support the extreme predictions made by the IPCC and the AGW cult.That's not what we're talking about. The subject is your claim that CO2 increases are an effect, not a cause. If you've read the Caillon et.al. paper, you'd know that your assertion is false.
That's not what we're talking about. The subject is your claim that CO2 increases are an effect, not a cause. If you've read the Caillon et.al
. paper, you'd know that your assertion is false.
The assertion is true because that is what the data shows; the temperature change comes first and the CO2 follows. To quote the author of the paper, "The sequence of events during Termination III suggests that the CO2 increase lagged Antarctic deglacial warming by 800 ± 200 years and preceded the Northern Hemisphere deglaciation."
The cause comes before the effect. Therefore temperature drives CO2, not the other way around.
Why not provide additional quotes from the paper, "VangelV"?
Because they throw your cause and effect relationship under the bus, correct?
Why not provide additional quotes from the paper, "VangelV"?
Because they throw your cause and effect relationship under the bus, correct?
I care about what the data shows, which is that temperature changes lead changes in CO2 concentrations by 800 years. In a world where the cause comes before the effect that falsifies the AGW claims that changes in CO2 concentrations drive temperature changes.
In science what matters is the objective evidence, not editorial narrative designed to attract more grant funding.
In a world where the cause comes before the effect that falsifies the AGW claims that changes in CO2 concentrations drive temperature changes.
Still having trouble with that strawman, I see. Also note that you've failed to take up my challenge to provide additional quotes from the paper that eviscerate your argument. So much for intellectual honesty from your side - not that I was expecting any.
In science what matters is the objective evidence, not editorial narrative designed to attract more grant funding.
Thanks for the morning joke.
"In a world where the cause comes before the effect that falsifies the AGW claims that changes in CO2 concentrations drive temperature changes."
Still having trouble with that strawman, I see. Also note that you've failed to take up my challenge to provide additional quotes from the paper that eviscerate your argument. So much for intellectual honesty from your side - not that I was expecting any.
"In science what matters is the objective evidence, not editorial narrative designed to attract more grant funding."
Thanks for the morning joke
The paper is clear that temperature change leads CO2 concentrations by 800 years. That does make the claim that CO2 drives temperatures a joke.
The paper is clear that temperature change leads CO2 concentrations by 800 years. That does make the claim that CO2 drives temperatures a joke.
Ever hear of a positive feedback?
You obviously haven't really read the paper - you're just pulling out the little piece(s) that get sent around the denialist blogosphere, and you're merely repeating them here.
Ever hear of a positive feedback?
You obviously haven't really read the paper - you're just pulling out the little piece(s) that get sent around the denialist blogosphere, and you're merely repeating them here.
The paper makes it clear that my claim is correct; temperature changes led changes in CO2 concentrations by around 800 years. That shows that temperature drives CO2, not the other way around.
And yes, I have heard of positive feedback. My nuclear physics and electrical engineering classes covered the subject. A positive feedback amplifies small changes into very big ones as the system in question is driven further and further from equilibrium. Good examples are reactions such as nuclear fission or chemical explosives.
Because I have a few minutes while the kids are playing I will go over the feedback issue briefly. Let us begin with the IPCC claims.
Few people know that the IPCC has reduced its forcing estimate for the direct effect of CO2 doubling. In the 1995 report the direct forcing was estimated to be 4.44 W/m^2; the feedback contributed another 3.58 W/m^2. By 2001 the direct effect was reduced to 3.71 W/m^2 while the feedback increased to 5.89 W/m^2. When 2007 rolled around the direct effect fell to 3.47 W/m^2 but the feedback was increased to 7.20 W/m^2. The value for the feedback multiplier f has increased from 1.80 in 1995 to 2.59 in 2001 to 3.08 in 2007.
The first thing to note is the problem with the direct forcing claims. As Richard Lindzen argues, the numbers are two or three times too high because the predicted mid-tropospheric warming signature does not exist. (See figure 9,1 in Section 9 of the 2007 IPCC report.) But we will ignore that problem and stick with the feedback assumptions.
What have so far is the IPCC arguing that 68% of the warming will be caused by feedback. You would think that such a claim would have much support from the literature, have a dedicated section in the report in which it is discussed , and have an assigned, Level Of Scientific Understanding. But it does not do any of those things. The critics point out, the value of f, which is the central issue in the feedback discussion and of the projected temperature change, has come from a single paper. There is no section which discusses the issue in its entirety and provides a discussion that explains the development of the value of f and there is no assigned Level Of Scientific Understanding. The central assumption that allows the models to come up with their scary predictions is ignored even as there are thousands of pages that discuss the implications of the model predictions.
The IPCC has yet another problem. We have palaeoclimatological data that shows that no runaway greenhouse effect has caused a runaway temperature increase over the past half billion years, even though CO2 temperatures were over 4,000 ppmv for quite a long period of time.
It may be that you do not wish to look at the palaeoclimatological data and want to stick with the modern data. That is fine because in this presentation Richard Lindzen shows that the satellite data proves that the IPCC feedback assumptions are wrong.
I hear the kids, which means that my twenty minutes are up. I hope that you go through the Lindzen presentation because it should get you to move away from the ridiculous feedback assumptions made by the modellers.
Don’t Panic -- Flaws In Catastrophic Global Warming Forecasts.
Clearly, "VangelV", you're changing the subject again, because you know your "temp leads CO2, so there's no problem" dog won't hunt.
You do realize that a signature of ACC is surface warming and stratospheric cooling... Which has been observed.
But, that won't keep you from erecting another strawman to mercilessly pummel. The first part of the video I posted is more relevant to your tactics, because the science of the later part is over your head.
I am not changing the subject. In the real world a cause comes before, not after the effect. The paper you cited clearly stated that temperature changes came first and CO2 changes followed 800 years later.
We both know that there is a lot of money in the AGW racket so it does not surprise me that a narrative to explain the inconvenient fact would be offered up by those that want to keep the grant money coming. But that does not change the fact that temperature is the cause of CO2 concentration changes just as the solubility curves predict.
As I said, if you want to argue about the feedback effects please provide the theoretical and physical evidence to support the high assumptions made by the IPCC modellers. Your problem is that you can't because, as Lindzen pointed out, the evenidence shows that the assumptions are too high and have the wrong sign.
Sigh.
VangelV is a horse who's been led to water, many times, but refuses to drink.
Your dogma has shut off your thinking processes.
"Your dogma has shut off your thinking processes."
Certainly that might be true of him. But I think you demonstrated, quite a while back, that it is true of you.
I simply do not believe that if your stock broker told you that the latest information showed your stocks were still going up, and in fact they had gone up for ten years, down for the last two, but were still above their long term average, you would consider his statement a truthful one.
Like I said, David, and as others have pointed out, an inflection point doesn't negate a trend.
One thing you might want to do is to collect the actual numbers from the NSIDC and do some analysis, rather than trying to squeeze out information from an image.
Sigh.
VangelV is a horse who's been led to water, many times, but refuses to drink.
Your dogma has shut off your thinking processes.
The facts are on my side. In the real world, causes precede effects.
Like I said, David, and as others have pointed out, an inflection point doesn't negate a trend.
One thing you might want to do is to collect the actual numbers from the NSIDC and do some analysis, rather than trying to squeeze out information from an image.
To suggest that for temperatures to have gone up after the end of a long cool period such as the Little Ice Age is unusual requires a great deal of evidence that is not provided by the AGW movement. To suggest that colder average temperatures and shorter growing seasons are preferable to warmer temperatures and longer growing seasons is illogical. And so is to argue that 68% of the warming effect will come from feedbacks when the satellite and geological records show no evidence of a large positive feedback.
Your argument really just comes down to correlation but even there the correlation is poor when compared to other factors.
Politics got involved with science right about when the global warming crap kicked off, you'll probably have a hard time trying to find anyone on the global warming committee willing to give you an easy to read chart that isn't deceptful in some way.
Post a Comment