Monday, June 22, 2009

Parenting, Peer Groups and Keeping Kosher

Judith Harris, in her very interesting The Nurture Assumption, argues that children's personalities are formed primarily by their peer group, not their parents, hence that parental child rearing has a surprisingly small effect on how the children turn out. By her account, the contrary opinion comes in large part from confusing genetic influence with environmental influence. She mentions, however, an interesting special case—where the family is the peer group.

I was reminded of this reading comments to several posts on my adult son's blog, in which he and commenters argue about whether and why one ought to have children, a discussion set off by his discovery that his views had over time become more nearly "socially conservative." I was struck by the number of people who seem to take for granted serious conflict between parents and children, both in their own background and in their concerns with what might happen if they had children.

That doesn't fit my experience. I cannot remember any point in my childhood at which my parents did not seem more nearly my sort of people than my age peers. The closest I came to rebellion, at some point in my teens, was informing my father that I had been feeling put upon, had considered the division of duties within the family, had concluded that I was getting off very lightly considering how much more my parents had to do, and had concluded that my feelings were due to adolescence not unfair treatment. I felt he should be warned, in case any of those unjustified feelings showed up in our interaction. Nor has there been any point so far in my interaction with my children—in particular the two I and my wife brought up (Patri's mother and I separated when he was an infant)—when they didn't feel like "us" not "them." Since the older is now in college, I think it's reasonable to conclude that that situation is not going to change.

My guess is that both as a child and as a parent, I was in a family that fit Judith Harris' special case—and I can see that parenting might be a lot less pleasant if I were not.

Which gets me to another book, one I have recently been rereading—Leo Rosten's The Joys of Yiddish. While organized as a list of words with detailed commentary, what it actually is is a picture of Ashkenazi-American culture in the first half of the Twentieth century, the world within which the author, and my parents, grew up. Features of that world included not only linguistic differences from the surrounding society but a lot of ritual, things done at particular times for particular reasons.

My friend and ex-colleague Larry Iannacone long ago raised the question of how, in a society like the U.S. with open entry to the religion industry, a religion can survive that imposes costly requirements on its adherents, requirements that do not produce any matching benefit. Why isn't such a religion always outcompeted by a new version that keeps everything else but dumps the costly restrictions—Judaism without koshruth rules, LDS with beer and coffee? His answer was that such restrictions do produce a "benefit"—they make it more difficult for adherents to interact outside of the religious community, and thus give them an incentive to spend time and effort producing community public goods, doing things that make being part of that community attractive.

It occurs to me that what I am seeing in Leo Rosten's affectionate description of the world he grew up in may be a special version of that relevant to the first half of this post. If you are brought up in an environment which is sufficiently special to make your age peers at school feel like "them" rather than "us" and your parents and siblings and relatives like "us" rather than "them," that may result in your identifying with the latter group. If their norms are better than those of the surrounding society, at least by their standards, they will see that as a good thing. Keeping their children is a benefit that may more than balance the costs of rules and rituals.

It doesn't have to be done through religion, of course, and in both of my cases it wasn't. My parents once raised the question, long after I was an adult, of whether they should have tried to bring me up in that same world, despite the fact that neither of them believed in their parents' religion. My response was that I preferred to have been brought up in the religion they did believe in—roughly speaking, 18th century rationalism, the ideology of Hume and Smith.

Which, of course, might be just as effective a way of making most of the outside world, including my age peers as I was growing up, feel like "them."

Friday, June 19, 2009

Cell Phone Bands—A Question

The frequencies used for both ordinary phone calls and 3G connections are different in different countries—one set in the U.S. and some other countries, a different set in Europe and much of Asia. A phone that can use four frequencies for phone calls and three for 3G can work just about anywhere. With three for phone calls, it works well in some parts of the world, less well in others--because there will be some areas where the missing frequency is the only one supported. With two frequencies for phone calls, a phone works in either Europe or the U.S., depending on what the frequencies are, but not both.

This raises an obvious question: Why don't all phones have four and three? One possible answer is that additional frequencies are in some way costly, require more expensive hardware or use more power. That does not strike me as very likely, but it isn't a subject I know much about.

A second possible answer is that phones are being deliberately designed to work well in only one area, in order to enable some form of price discrimination.

Do any of my readers know the answer? From the standpoint of this consumer, the consequence of the limitation is that, not uncommonly, the phone I am most interested in is out in a European version but not an American version.

Wednesday, June 17, 2009

Cell phone gadget frustrations

As long term readers of this blog know, I have for years been searching for a cell phone equivalent of my beloved Psion PDA's, a pocket computer with a useable keyboard. The closest I have managed so far is the G-1, which at this point it has most of what I want, including a word processor that can read and edit Word documents. But the keyboard is too small for real typing, the screen small for web browsing, and it does not support an external keyboard. Also it is from T-mobile, a carrier about which I have some reservations—although I have now learned that I could switch back to AT&T, which does not sell the G-1 but does support it.

I recently came across online references to the new HTC Touch Pro 2, which has a considerably larger screen and keyboard than my G-1 and seems to meet most of my other requirements. But ... .

The model currently out supports only the European 3G frequencies, and I live in the U.S. AT&T is supposed to be bringing out a U.S. model, but according to leaked pictures it will have a shrunken QWERTY keyboard in order to fit in an entirely unnecessary numeric keypad.

There are times when it would be nice to be dictator of the world. At least for a minute or two.

Sunday, June 14, 2009

Harald Podcasts are Now All Up

I have now recorded all of my novel Harald (not counting the glossary). If you notice any problems, let me know by email.

Thursday, June 11, 2009

Arctic Sea Ice Briefly Continued

I had a couple of recent posts, pointing out what appeared to be an inconsistency between the claim on a JPL page that the latest data showed arctic sea ice continuing to shrink and the publicly available data, which appears to show that a ten year decline reversed a bit over a year and a half ago. None of the commenters on the posts managed to explain away the discrepency, so I emailed someone at NASA. He was a pleasant and courteous correspondent, but seemed unable to distinguish between the question "do we have reason to expect arctic sea ice to continue to shrink" and the question "is what JPL said on this page about the evidence true?" Eventually he conceded that he was a media person, not a scientist, sent my question off to a scientist at the National Snow and Ice Data Center, and sent me the response.

That response again ignored the question of whether what JPL said was actually true, to focus on whether the conclusion they were arguing for was true. I emailed him, pointing out that what I was asking was not whether there was good reason to expect further shrinking but whether the JPL assertion about the current data was true or false.

I got back an evasive answer that came down to (not a quote) "the long term trend is down, so objecting that JPL says the current data shows that trend continuing when it doesn't is merely a technical semantic objection."

I concluded that he, unlike the gentleman at NASA, understood my question, and that his real answer was that it was all right to lie to people about the evidence as long as you were telling them what you thought was the truth about the conclusion. I sent him off a reference to the Orwell piece that discusses the dangers of suppressing the truth for fear that it would "play into the hands of" the opposition.

And I now know that nothing said by NASA/JPL ought to be trusted. Readers of this blog may want to check the JPL claim against the data for themselves before deciding whether or not they agree with that conclusion. I have provided the links above.

Sunday, June 07, 2009

G-1 Root and Tether: Help

As I mentioned in an earlier post, my online exchanges with T-Mobile support imply that T-Mobile does not object to my tethering my G-1, although they don't support it. I'm not sure if that's really the corporate view of the matter, but having been told so by two levels of their tech support I think I am entitled to try it.

So I did. The first step is to get root access, taking advantage of a bug in the original version of the OS. I successfully downgraded my OS to the original version (CR29), and I believe I got root access--at least, the attention symbol in the Terminal window is # rather than $.

I have been unable, however, either to make Android-WiFi-Tether work under CR29 or to install the upgrade that is supposed to take the OS back up to a more recent version while preserving root access.

Is there any kind soul among my readers with suitable expertise who would like to advise?

Saturday, May 30, 2009

Carbon Taxes, Cap and Trade, and All That

Suppose something some people do has substantial, widely dispersed, negative effects on other people; the standard example is air pollution. Since I am not bearing the cost of my actions, I may do things, such as light a fire in my fireplace, even when the net cost, to me and others, is larger than the benefit, and fail to do things, such as install a scrubber in the smokestack of my power plant or switch to low sulfur coal, even when the benefit of doing them would be larger than the cost. The obvious solution is direct regulation. Have some government agency tell power plants to install scrubbers, use low sulfur coal, and in various other ways modify their acts to take account of external effects.

There are at least two things wrong with this solution. The first is that the agency is very unlikely to know enough to do it right. How is it to figure out what the lowest cost way is of reducing pollution—scrubbers, low sulfur coal, both, or one for some power plants and some for others? How, indeed, is it to figure out when pollution ought to be reduced and when the cost of the reduction is more than the benefit? Carbon dioxide, after all, is said to be a pollutant via global warming; it does not follow that we should all stop breathing.

The second problem is that even if the agency had the information, it might not be in its interest to use it correctly, to require reductions of pollution if and only if they are worth their cost and by the least costly means. Such an agency is run, after all, not by philosopher kings but by bureaucrats appointed by elected politicians. If states that produce high sulfur coal are politically influential, it might be wise to impose regulations designed to discourage utilities from switching to low sulfur coal even when that is the lowest cost way of reducing the amount of air pollution they produce (a real world example, as it happens; see Regulation Magazine Vol. 14 no.4). If the steel industry has made generous campaign contributions to the majority party, perhaps it should be spared, in the national interest, the rigors of regulation of its emissions.

An alternative which many economists prefer is a "Pigouvian Tax," named after the economist who came up with the idea. Let the agency determine the external cost imposed by each ton of sulfur dioxide released into the atmosphere. Firms are free to pollute as much as they want, provided they pay for their pollution. It is then in the private interest of each firm to find the lowest cost ways of reducing its pollution and implement them, provided that the cost of the reduction is less than the benefit.

This does not eliminate all of the problems, since the agency still has to measure cost and still may be biased in its estimates of the differing costs of different effluents in different places by political considerations. But it looks like a considerable improvement on direct regulation.

A very similar alternative is currently being discussed under the label of "cap and trade." The government sets the total amount of effluent that may be emitted—say 80% of the pre-regulation level. Each firm is issued permits for its share of that amount, 80% of the sulfur dioxide it produced last year. A firm that reduces its emissions below that level can sell the excess permits to other firms; a firm that pollutes above the level it has permits for must buy additional permits. In effect, the price of the permit is the equivalent of the effluent fee under Pigouvian taxation. A firm that pollutes more than its share must pay that price for each additional ton of effluent. A firm polluting less than its share gives up, for each ton it emits, the opportunity to sell a permit for that price. Once the level of emissions is set, the market determines the cost of reducing emissions to that level and sets the required tax.

In a system run by philosopher kings, there is one important difference between the two alternative versions. A straight Pigouvian tax requires the agency to estimate the damage done by an additional ton of the pollutant. A cap and trade system requires it to estimate what the optimal amount of the pollutant is, how far it is worth reducing it. One can imagine some situations where the former information is more readily available, some where the latter is.

In a system run by elected politicians, there is another large difference—who gets the money. With an effluent fee, the tax goes to the government. With cap and trade, the payments are by one firm to another. Firms that can easily reduce their output of effluent end up richer than they would be without the scheme, since they can sell their excess permits to other firms for whom reduction is more difficult. Indeed, the regulated industry as whole may end up richer as a result of the regulation. Depending on the details of the situation, the increased income from the higher price for (say) electric power due to the higher cost due to the regulation might be more than the cost to the firms of reducing their emissions to meet the limit.

Which brings us to current proposals for cap and trade of carbon dioxide as a solution to problems of global warming. In a system run by philosopher kings, the only important difference between that and a carbon tax is the information required to set the level of emissions or amount of tax. In the real world, cap and trade has the (political) advantage of getting large parts of the regulated industry in favor of the regulation and thus eliminating a lot of potential opposition. The cost, possibly more than a hundred percent of it, is shifted to the customers, which is to say the general public—a dispersed and politically impotent interest group. And if the government retains considerable flexibility in just how emission permits get allocated, it can use some of them to buy political support from other groups or to reward them for past support.

Cap and trade has a political disadvantage as well, of course; a carbon tax would bring in lots of money. But that money would show up in the budget, get labelled taxation, and so make it harder for the administration to deny that it is raising taxes to pay for its programs. And much of it might end up spent to get the carbon tax passed by buying off organized interest groups that were potential opponents.

Think of the cap and trade version as eliminating the middle man.

Tuesday, May 26, 2009

The Rising Marginal Cost of Originality or What is Wrong with Modern____

Suppose you are the first city planner in the history of the world. If you are very clever you come up with Cartesian coordinates, making it easy to find any address without a map, let alone a GPS—useful since neither GPS devices nor maps have been invented yet.

Suppose you are the second city planner. Cartesian coordinates have already been done, so you can't make your reputation by doing them again. With luck, you come up with some alternative, perhaps polar coordinates, that works almost as well.

Suppose you are the two hundred and ninetieth city planner in the history of the world. All the good ideas have been used, all the so-so ideas have been used, and you need something new to make your reputation. You design Canberra. That done, you design the Combs building at ANU, the most ingeniously misdesigned building in my personal experience, where after walking around for a few minutes you not only don't know where you are, you don't even know what floor you are on.

I call it the theory of the rising marginal cost of originality—formed long ago when I spent a summer visiting at ANU.

It explains why, to a first approximation, modern art isn't worth looking at, modern music isn't worth listening to, and modern literature and verse not worth reading. Writing a novel like one of Jane Austen's, or a poem like one by Donne or Kipling, only better, is hard. Easier to deliberately adopt a form that nobody else has used, and so guarantee that nobody else has done it better.

Of course, there might be a reason nobody else has used it.

Sunday, May 24, 2009

Two Great Depressions

Current economic problems have brought back beliefs and arguments concerning the Great Depression. One account I have encountered goes roughly as follows: "After the stock market crash, Hoover cut taxes and government expenditure in order to revive the economy. Instead of reviving, things got worse and worse until Roosevelt came in, introduced the New Deal, and so eventually ended the Depression." The obvious conclusion is that we should deal with present problems, as the administration is dealing with them, by vastly expanding government expenditure.

The first half of this is a simple factual claim, easily checked. The current Statistical Abstract of the United States is conveniently webbed, but does not go back far enough to provide figures for expenditure under Hoover; Historical Statistics of the United States, so far as I can tell, is webbed only in a for-pay version. But earlier volumes of the Statistical Abstract are also webbed. The 1935 volume contains figures both for federal expenditure and for prices in the relevant years. Federal expenditure was:

1929 3,298,859
1930 3,440,269
1931 3,779,868
1932 4,861,696

Far from being cut, it increased every year.

These figures greatly understate the increase, because during this period prices and national income were falling. Measured in purchasing power rather than in dollars, federal expenditure roughly doubled over the final three years of Hoover's administration. Relative to GDP, it nearly tripled.

The second half of the story is trickier, because it depends on assumptions about what would have happened without the New Deal—that the Depression would have continued forever, or at least for much longer. That seems implausible, judging by other depressions and recessions; the Great Depression was unusually long, not unusually short. Arguing that since the economy eventually recovered the New Deal was a success is like arguing that if the doctor bleeds the patient and the patient survives and eventually recovers, the treatment was a success.

We can learn a little more by looking at a different Great Depression—the one that didn't happen. From 1920 to 1921, the consumer price index fell by 10.8%, more than in any year of the Great Depression; it fell another 2.3% in the next year. Unemployment rose to about its 1931 level. Looking just at that data, it's obviously the start of a depression.

Harding did what Hoover is supposed to have done, reducing taxes and government expenditure. By 1923 the recession was over. It was the Great Depression that didn't happen.

Thursday, May 21, 2009

Fairness in Sports: A Modest Proposal

To increase agricultural output on a fixed amount of land, you increase labor and fertilizer. If a nuclear limitation treaty limits the number of missiles, a nation that wants to maintain its arsenal does it by increasing the size of warheads, the number of warheads per missile, or both.

Consider the same principle in the context of sports. A football team faces an artificial constraint on the resources used to produce victory—it is only allowed eleven men on the field at a time. It responds, naturally enough, by making them big men. Very big.

The obvious solution to the manifest unfairness of this result—blatant bigism—is a small change in the rules. Instead of limiting the number of players on the field, limit their total weight. A team is allowed to have up to 2400 pounds of players on the field at one time. That can be a ten man team averaging 240 lbs, a fifteen man team averaging 160 lbs, or any other mix that produces the same total. For basketball, perhaps the constraint should be on total height instead of total weight.

It should be interesting.

Tuesday, May 19, 2009

Does Free Love Promote or Impede Successful Marital Search?

Listening to satellite radio while driving, I occasionally come across the Cosmo channel. The assumed target audience seems to consist of women engaged simultaneously in a search for a long-term partner—a "keeper"—and a dating pattern involving a good deal of relatively casual sex. This raises an interesting question: does the latter make success in the former more or less likely? It is an old question, but the sexual revolution may provide new evidence.

On theoretical grounds, the answer is unclear. There are two obvious arguments against the modern pattern. The first is that, in a society where sex is readily available without marriage, the incentive to engage in a protracted search for a long term partner, costly in time, effort, and emotion, is much lower than in a society with more traditional mating patterns. The second is that sex, at least in humans, has emotional consequences—you feel differently about someone after sleeping with her (or him) than before. Arguably, in humans, one consequence is to reinforce emotional bonds that promote long term pairing—plausible both on subjective evidence and on obvious evolutionary grounds, given that human infants require extended care. That makes it at least plausible that the bonds forged with your fiftieth sex partner will be weaker than the ones forged with your first or second, making marital stability, when the keeper is finally found, less likely.

There are two obvious arguments in the other direction. The first is that if individuals very much desire sex and cannot get much of it outside of marriage, there is an incentive to marry in haste and repent at leisure, wed the first moderately acceptable partner willing to say yes. The second is that a successful sexual relationship makes a successful marriage more likely, so the parties are less likely to regret their choice if they try before they buy.

My question is whether anyone has produced good empirical data to tell us which side of the argument turns out to be more important. It is not enough to observe that divorce rates have gone up along with rates of non-marital sex. That might be due to other causes, most obviously easier divorce. Better evidence would be some sort of large scale longitudinal study, aimed at distinguishing the success in establishing marital (or long term non-marital) partnerships of people as a function of their prior willingness to engage in relatively casual sex. Even that, of course, has problems, since we don't have any way of creating a true controlled experiment—but an ingenious researcher might find a natural experiment that came close.

Monday, May 18, 2009

A Healthcare Idea: Insurance That Doesn't Pay

One obvious, arguably ideal, solution to the problem of paying for healthcare is for the consumer to pay for ordinary costs out of pocket, just as we pay for food and housing, while using insurance to cover extraordinary costs, just as we use it in other contexts. That is not the usual pattern of medical insurance in the U.S., however—typically it covers a large part of the cost of annual doctor's visit, ordinary dental care, and the like. That arrangement has some obvious disadvantages. The customer has no incentive to hold down costs, making it necessary for the insurance company to play a major role in the decision of what services the customer gets from what providers.

One reason for this arrangement is that health care you pay for directly is paid with after-tax dollars, health insurance via your employer with before-tax dollars, giving a substantial advantage to the latter. But there may be another reason as well.

From time to time one sees accounts of a patient who was billed for something and discovered that the cost was much more than what the hospital charged an insurance company for the same treatment. Such anecdotes are not, by themselves, very strong evidence, and I do not know how common the pattern is—I have also seen stories in which the discrepancy was in the other direction, after some bargaining by the patient. But it does make a certain amount of sense. The insurance company is a well informed purchaser bargaining in advance on behalf of lots of customers, so it wouldn't be surprising if it were able to get better terms than the hospital offers to an individual who requires treatment.

This suggests an obvious possibility—"insurance" companies whose main function is not insurance but negotiating prices. Within the current framework, that would mean a policy with a very large deductible, large enough so that the customer ended up paying for all ordinary medical care, giving him an incentive to hold down its cost as best he could. In the limiting case it would mean a company that provided no insurance at all, simply the service of negotiating for its customers, in advance, prices for medical service, and perhaps offering customers advice as to what they ought to purchase from what provider.

To what extent do such arrangement already exist? Is there a problem with them that I am missing? They don't deal with the implicit tax subsidy issue, but they would seem to solve the other problem.

Wednesday, May 13, 2009

Sea Ice II: Reading Graphs

My previous post contained a graph of northern hemisphere sea ice from which it seemed clear that the past trend of declining area, rather than continuing as the JPL claimed, had reversed. The first comment on that post claimed that I had cherry picked my data, offering as evidence another graph presenting the information in a different form which, the commenter said, supported the JPL claim.

As I pointed out in my response, his graph did not support the claim either, although it did not contradict it as strikingly as mine did. That raises the question of why two graphs from the same web page presenting the same information looked so different. While it might be possible to answer it by searching out additional information on the web site, I thought it would be more interesting to see what one can figure out simply by looking at the graphs. I will refer to his graph as graph A and mine as graph B. Both are shown below.

Graph A--------------------------------------------------
Graph A shows swings within each year over a range of about ten million square kilometers, presumably reflecting expansion and contraction of the area of sea ice with the seasons. The variation in Graph B within each year is much smaller and less regular. Pretty obviously that means that the data in Graph B is seasonally adjusted. The figure for, say, January of 2009 shows how much higher or lower the area of sea ice was than the average for Januaries over the reference period, eliminating the seasonal variation. That fits the title. The graph is showing, not the area, but the anomaly, the difference between the area at that time and its previous average.

That way of drawing the graph makes it easier to see trends, since changes over the years aren't masked by the much larger changes within each year. A more subtle difference is that, looking at graph A, one loses almost all of the relevant data. The month to month difference is so large that one cannot tell by eye whether sea ice area in January of 2008 was more or less than in 2009. All you can see is that sea ice area in the month when it was largest was about the same in 2008 as in 2009, and sea ice area in the month when it was smallest was a little larger in the second year. You are left trying to interpret trends based only on the extremes of the cycle—data from two observations a year instead of about twelve.

Graph B, by eliminating the seasonal effect, gives a much clearer picture. If sea ice area was larger in ten months of the second year than in the corresponding months of the first year and lower in two, that will show as a rising trend with a couple of downticks—even if the low months happened to also be the extremes. What the commenter viewed as noise on Graph B—the shifts up and down month by month—is information, information obscured by the large seasonal variation on Graph A.

[To see the webbed graphs, which are larger and clearer than the images here, click on the Graph A and Graph B links]
-----------------------------------------------
As a result of a comment to this post, I found a graph showing April sea ice cover from the National Snow and Ice Data Center, the source that the JPL article cites. Here is the graph. It shows ice extent rising for the past two years.

(Later addition)

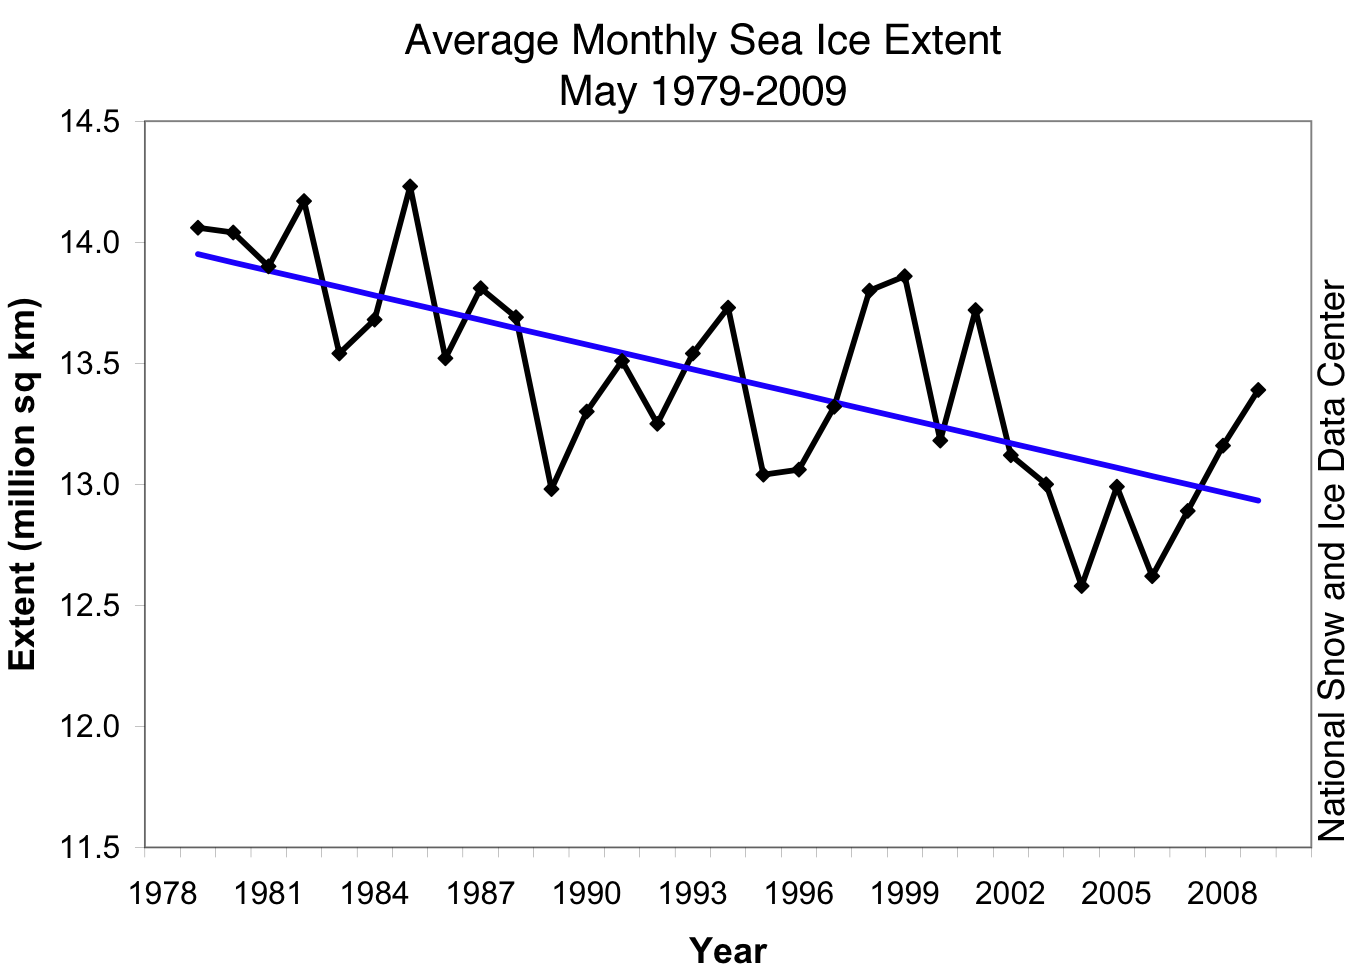
The data from the same source for May are now in. May sea ice extent has risen for the past three years, bringing it back to about its level in the late 1980's early 1990's.

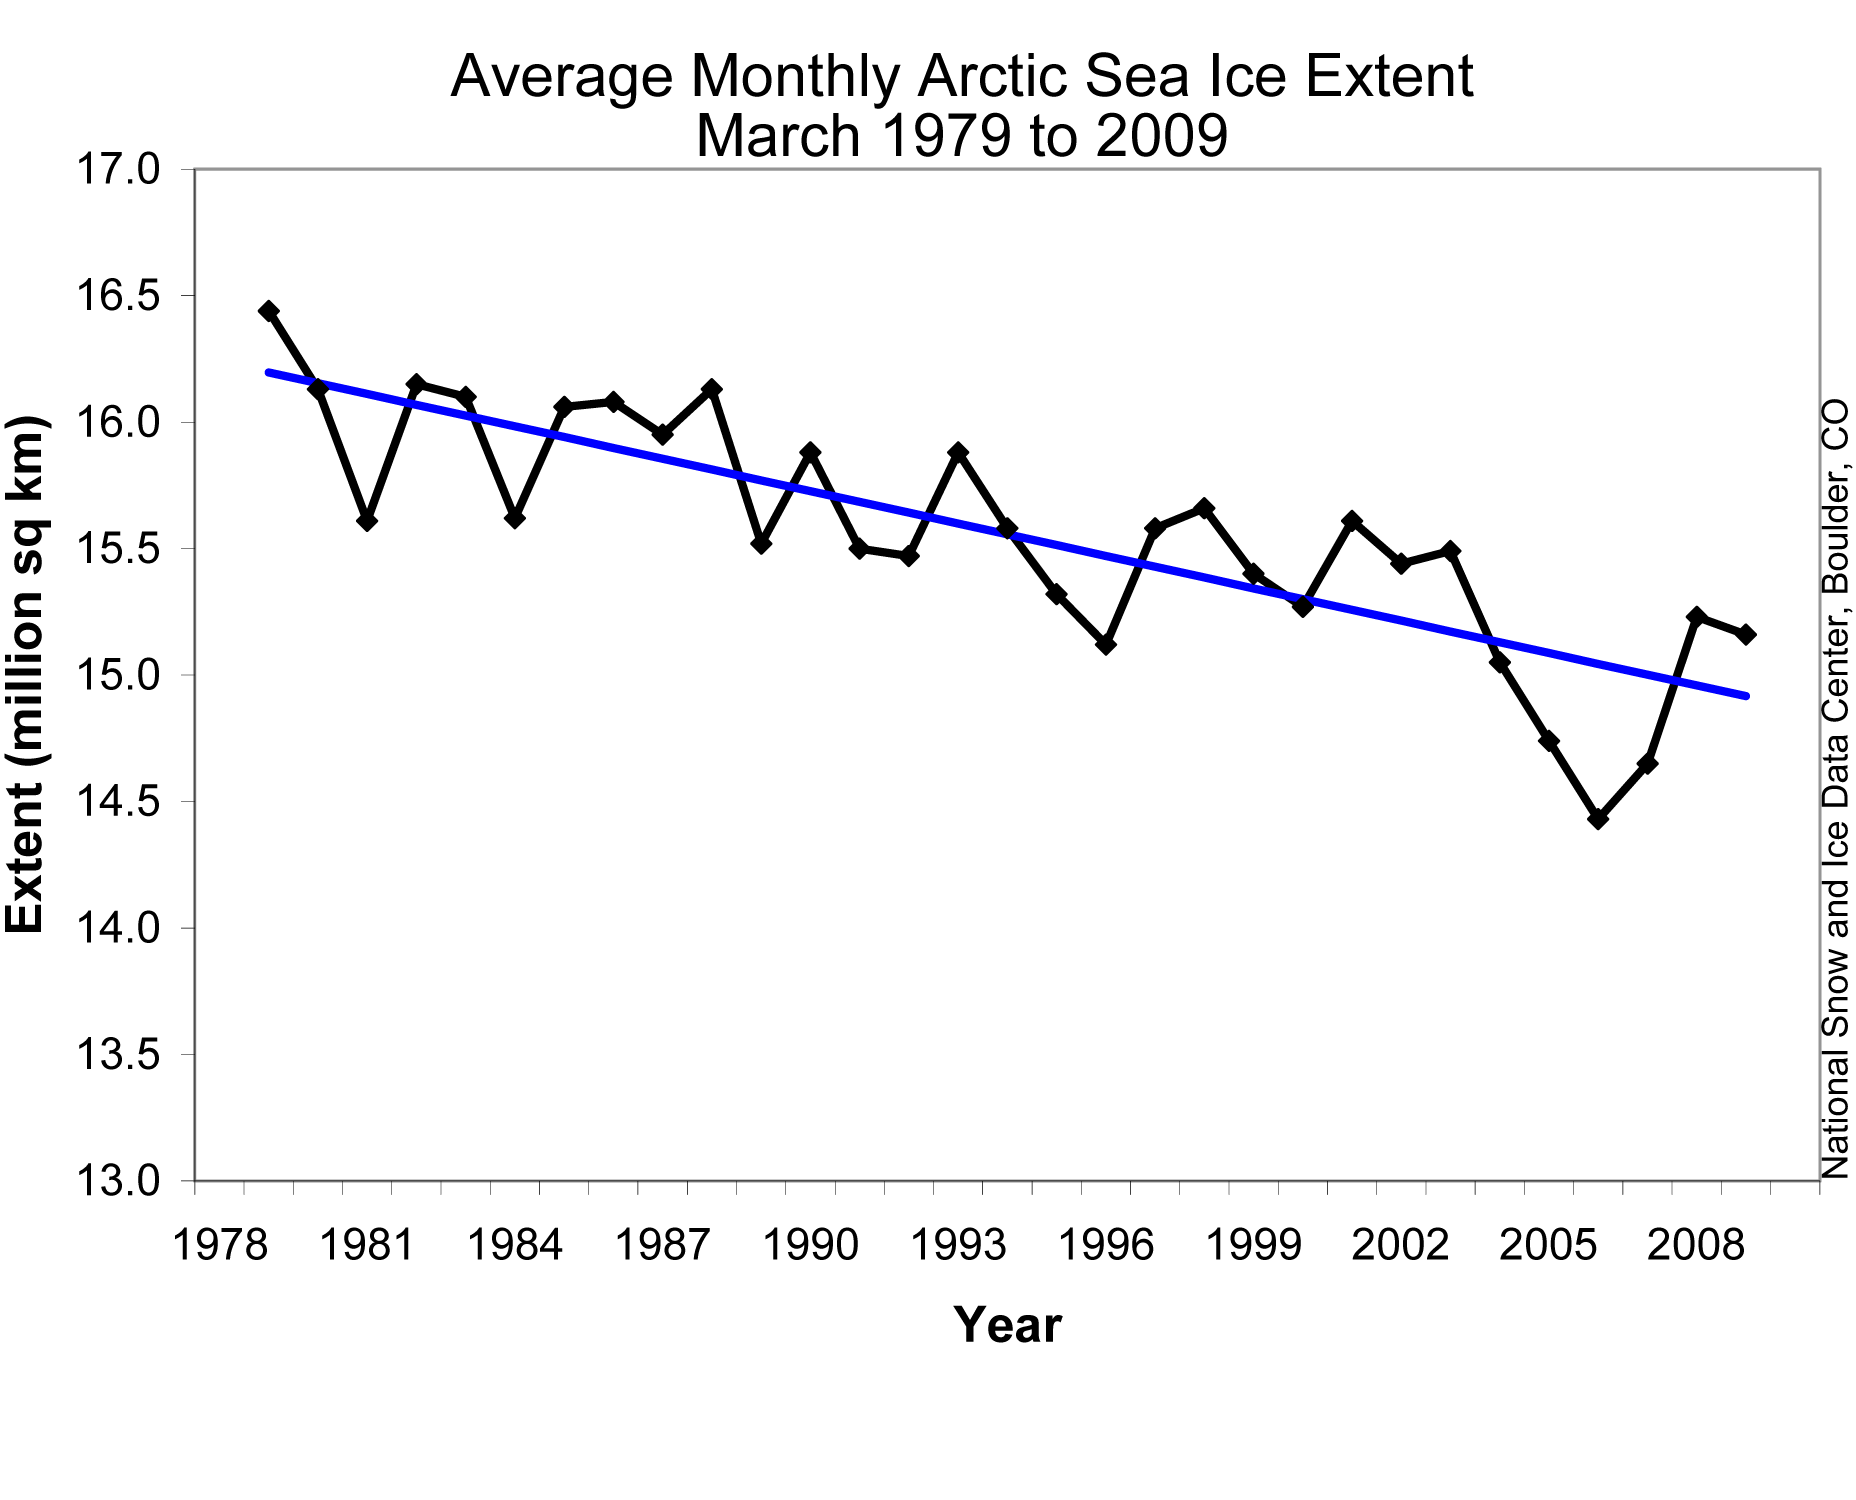
On the other hand, poking around the same source, I found the graph for March, which provides at least a little support for the JPL comment I have been attacking, which was published in April. It shows March sea ice rising a lot for two years, but falling a little in the most recent year. To describe that as "continues to shrink" strikes me as clearly misleading, but it's an exaggeration to describe it as a flat lie.