Showing posts sorted by relevance for query climate. Sort by date Show all posts

Monday, March 31, 2014

Bits From the Latest IPCC Report

(all quotes from the summary for policymakers)
In this report, the term impacts is used primarily to refer to the effects on natural and human systems of extreme weather and climate events and of climate change
Or in other words, they are lumping together costs associated with climate change due to human action, costs associated with climate change from other causes, and costs associated with extreme climate events, whether or not due to climate change.
In recent decades, changes in climate have caused impacts on natural and human systems on all continents and across the oceans. ... Evidence of climate change impacts is strongest and most comprehensive for natural systems.  ... See supplementary Table SPM.A1 for descriptions of the impacts (B) Average rates of change in distribution (km per d ecade) for marine taxonomic groups ... . Positive distribution changes are consistent with warming (moving into previously cooler waters, generally poleward).
"Impacts" sounds scary, but, as the quote shows, only means change.
While only a few recent species extinctions have been attributed as yet to climate change (high confidence), natural  global climate change at rates slower than current anthropogenic climate change caused significant ecosystem shifts and species extinctions during the past millions of years.
Warnings about large numbers of species being driven to extinction by anthropogenic climate change have morphed into the observation that species have gone extinct in the past for reasons unrelated to human action.
Some low-lying developing countries and small island states are expected to face very high impacts that, in some cases, could have associated damage and adaptation costs of several percentage points of GDP.
Compare costs of "several percentage points of GDP" in the places most at risk due to sea level rise with past rhetoric of hundreds of millions of climate refugees, drowned island chains, and the like.
Climate change has negatively affected wheat and maize yields for many regions and in the global aggregate (medium confidence). Effects on rice and soybean yield have been smaller in major production regions and globally, with a median change of zero across all available data
They don't actually say that yields have fallen, although that is what a careless reader is likely to think they are saying, only that they are lower than they would have been without climate change. A little searching finds a scholarly article on wheat yields, published in 2012, which reports that 
Wheat yields have increased approximately linearly since the mid-twentieth century across the globe, but stagnation of these trends has now been suggested for several nations. .... With the major exception of India, the majority of leveling in wheat yields occurs within developed nations—including the United Kingdom, France and Germany—whose policies appear to have disincentivized yield increases relative to other objectives. The effects of climate change and of yields nearing their maximum potential may also be important.
...

Near the time that leveling is generally observed, the European Union shifted away from a policy that rewarded high agricultural production through price guarantees to a policy that pays flat subsidies that do not increase with production and triggers taxes when production limits are exceeded
So what has actually happened is not that yields have decreased but that in some areas they have stopped increasing, at least in part due to changes in agricultural policy.
At present the world-wide burden of human ill-health from climate change is relatively small compared with effects of other stressors and is not well quantified. However, there has been increased heat-related mortality and decreased cold-related mortality in some regions as a result of warming ... .
The first sentence makes it sound as though climate change is making things worse. The second implies that there have been both costs and benefits and offers no estimate of their relative size.
People who are socially, economically, culturally, politically, institutionally, or otherwise marginalized are especially vulnerable to climate change.
One might conclude that keeping poor people poor, for instance by pressuring poor countries to produce less energy or produce it in more expensive ways in order to hold down CO2 output, will do more damage than good.
Impacts from recent climate-related extremes, such as heat waves, droughts, floods, cyclones, and wildfires, reveal significant vulnerability and exposure of some ecosystems and many human systems to current climate variability.
Note that the extremes are not limited to those due to climate change. Floods, cyclones, et. al. do damage...and always have. 
For the major crops (wheat, rice, and maize) in tropical and temperate regions, climate change without adaptation is projected to negatively impact production for local temperature increases of 2°C or more above late-20th-century levels, ...
Emphasis mine. If farmers ignore the implications of climate change on what crops they should grow how and continue to ignore them for the next sixty years or so, output is expected to decline.
With these recognized limitations, the incomplete estimates of global annual economic losses for additional temperature increases of ~2°C are between 0.2 and 2.0% of income (±1 standard deviation around the mean)
I have not yet gotten into the full report but, judging from accounts I have seen, 2°C of additional warming is about what it suggests we can expect by 2100 if we don't do much to prevent it. So if policies to prevent warming reduce the annual growth rate of world income from (say) 2% to 1.98%, the resulting loss will just about cancel the gain. Not a compelling argument for switching from fossil fuels to solar power.

All of these quotes are from the first half of the summary for policy makers—I have not yet tried to get into the full report. My conclusion is that the IPCC's estimates of the negative effects of climate change due to human action are much smaller than the rhetoric surrounding the subject suggests, a fact the report attempts to conceal as best it can by its presentation.

And a fact that does not come through in news stories about the report, at least those I have so far looked at.

How long before the more enthusiastic true believers start accusing the IPCC of having sold out to the oil industry?


Sunday, July 05, 2009

Does Climate Catastrophe Pass the Giggle Test?

The argument for doing drastic things to prevent global warming has two parts. The first has to do with climate change, with reasons to think that the earth is getting warmer and that the reason is human action, in particular the production of CO2. The second has to do with consequences of climate change for humans.

Most of the criticism I have seen, in comments to this blog and elsewhere, has to do with the first half, with critics arguing that the evidence for global warming, or at least the evidence it is caused by humans and will continue if humans do not mend their ways, is weak. I don not know enough to be sure that those criticisms are wrong; pretty clearly climate is a very complicated and not terribly well understood subject. But my best guess, from watching the debate, is that the first half of the argument is correct, that global climate is warming and that human action is at least an important part of the cause.

What I find unconvincing is the second half of the argument. More precisely, I find unconvincing the claim that climate change on the scale suggested by the results of the IPCC models would have catastrophic consequences for humans. Obviously one can imagine climate change large enough and fast enough to be a very serious problem—a rapid end of the current interglacial, for example. And if, as I believe is the case, climate is not very well understood, one cannot absolutely rule out such changes.

But most of the argument is put in terms not of what might conceivably happen but of what we have good reason to expect to happen, and I think the outer bound of that is provided by the IPCC models. They suggest a temperature increase of about two degrees centigrade over the next hundred years, resulting in a sea level rise of about a foot and a half. What I find implausible is the claim that changes on that scale at that speed would be catastrophic—sufficiently so to justify very expensive measures now to prevent them.

Human beings, after all, currently live, work, grow food in a much wider range of climates than that. Glancing over a U.S. climate map, it looks as though all of the places I have lived are within an hour or two drive of other places with an average temperature at least two degrees centigrade higher. If people can currently live, work, grow crops over a temperature range of much more than two degrees, it is hard to imagine any reason why most of them couldn't continue to do so, about as easily, if average temperature shifted up by that amount—especially if they had a century to adjust to the change. That observation raises the question with which I titled this post: Does climate change catastrophe pass the giggle test? Is the claim that climate change of that scale would have catastrophic consequences one that any reasonable person could take seriously?

I can only see two ways of defending such a claim. The first is some argument to show that present arrangements are, due to divine intervention or some alternative mechanism, optimal, so that any deviation, even a small one, can be expected to make things worse. The second, and less wildly implausible, is the observation that people have adapted their activities—the sort of houses they live in, the varieties of crops they grow—to current conditions. Put in economic terms, we have sunk costs in our present way of doing things. Even if the planet has not been optimized for us, we have optimized our activities for the planet, with the details depending in part on the local climate. Hence any change in either direction can be expected to be a worsening, making our present way of doing things less well adapted to the new conditions.

That would be a persuasive argument if we were talking about a substantial change occurring over five or ten years. But we aren't. We are talking about a not very large change occurring over a century. In the course of a century, most existing houses will be replaced. If temperatures are rising, they will be replaced with houses designed for a (slightly) warmer climate. If sea levels are rising, they will be replaced, in low lying coastal areas, with houses a little farther inland. Over a century, farmers will change at least the varieties they are growing, very possibly the kind of crop, multiple times, in response to the development of new crop varieties, shifting demand, and similar changes. If temperatures are rising, they will gradually shift to crops adapted to a (slightly) warmer climate.

Climate aside, we do not live in a static world—consider the changes that have occurred over the past century. The shifts we can expect to occur due to technological progress alone, even without allowing for political and demograpic shifts, are much larger than the shifts required to deal with climate change on the scale I am discussing.

My conclusion is that this version of climate catastrophe, at least, does not pass the giggle test. There may be other versions, based on more pessimistic predictions of climate change, that do. But the claim that we now have good reason to expect climate change on a scale that will produce not merely problems for some but catastrophe for many is one that no reasonable person should take seriously.

Saturday, September 10, 2016

Future Climate and the Food Supply

I recently had an experience both rare and pleasant, a civil and informative argument about climate on FaceBook. It was started by
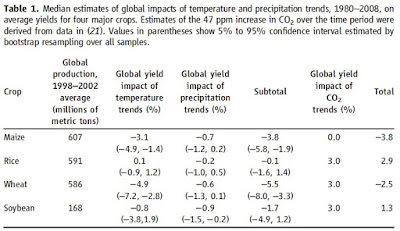
One of the commenters, although not prepared to defend the hysterical tone of the posted piece, was willing to argue that climate change was making the global food situation worse and threatened to make it much worse in the future. In defense of that claim, he cited "one recent study showing four major global crops declining (relative to no climate change)." The article, "Climate Trends and Global Crop Production Since 1980"  (Lobell et. al. 2011), was an attempt to separate out the effects on four major crops of different environmental changes–temperature, precipitation, and CO2 concentration–occurring from 1980 to 2008.

Reading it, I noticed that what the authors defined as the effect of climate change included temperature and precipitation but not CO2; its (positive) effect was listed separately. Including it changed the conclusion from four crops down to two down, two up. The commenter who offered the article as evidence had apparently missed that fact.

I also noticed that while they found a significant warming trend over the period, the trend in precipitation was statistically insignificant – consistent with random change. Redoing the calculation using only the two effects we knew were associated with AGW, warming and increased CO2 concentration, made the percentage increase in rice equal to the decrease in maize, the increase in soybeans larger than the decrease in wheat. The figures are shown in Table 1 from the article.

The table showed no effect of increased CO2 on the yield of Maize. Maize, as the gentleman I was arguing with pointed out, is a C4 crop, the other crops C3, the difference being in the details of the mechanism for photosynthesis. The effect of CO2 fertilization on C4 crops is substantially less than on C3 crops but not zero. Looking at another article that had been linked in the discussion, this one from the EPA, I found:
The yields for some crops, like wheat and soybeans, could increase by 30% or more under a doubling of CO2 concentrations. The yields for other crops, such as corn, exhibit a much smaller response (less than 10% increase).
That suggests that the effect is less than a third as large as the effect on the C3 crops but still substantial. Including it on Table 1 makes the negative net effect on maize smaller than the positive effect on rice.

Looking at the EPA article I noticed that the increase in  yield due to CO2 fertilization was presented as a fact, various things that might decrease yields as possibilities.
"if temperature exceeds a crop's optimal level or if sufficient water and nutrients are not available, yield increases may be reduced or reversed." 
"Extreme events, especially floods and droughts, can harm crops and reduce yields."
 No evidence was offered that any of those things would happen or how large the effects would be if they did. It looked as though the authors wanted to give the impression that climate change would reduce agricultural yields but prudently stopped short of saying so.

I also noticed:
"Overall, climate change could make it more difficult to grow crops, raise animals, and catch fish in the same ways and same places as we have done in the past."
As conditions change, people change what they do in response. If temperatures rise, farmers will shift to crop varieties suited to a warmer environment. If rainfall increases or decreases, they will adjust crop varieties, irrigation, other details accordingly. What would happen if farmers ignored environmental changes in deciding how to farm tells us very little about what will happen in the real world. Whether or not we have global warming, it is quite unlikely that, a century from now, people will grow crops, raise animals, and catch fish in the same ways and the same places as they do now.

The same issue is relevant to the other article. The authors estimated the effect of increased temperature on yield by looking at how yields had varied with temperature, year by year, in the past. Those estimates were  used to calculate the effect of the overall increase in temperature over the period and suggest possible effects of future increases.

To see the problem with that approach, consider a farmer at planting time. He does not know how hot the year will be, how much rainfall there will be. Decisions such as when to plant and what varieties to plant can only be based on the expected value of those variables.

A farmer in 2100 knows what changes in climate have occurred over the previous century so  can take account of those changes in how he farms. It follows that models based on observations of year to year variation will show a more negative effect of climate change than can be expected from gradual change over a long period of time. The authors of the article noted that problem along with other limitations to their analysis.

Most of the time, all I learn from arguing climate with people on FaceBook is how unreasonable most people engaged in the argument, on both sides, are. This was a pleasant change. 


I will have to wait to see whether my opponent has become less confident that climate change threatens the global food supply now that he knows that the article that he thought supported that claim is, if anything, mild evidence against it.

Saturday, April 05, 2014

Climate Nuts vs the IPCC

In one recent climate thread on Google+, I was informed, by three different people, that global warming would:

Create two billion climate refugees

Flood most of the world's large cities

Destroy civilization.

The simplest rebuttal to such claims is the latest IPCC report. The IPCC, after all, is doing its best to persuade people to support action to slow global warming, so unlikely to minimize the problem. But if you look not at the rhetoric but at the factual claims, the impending climate catastrophe looks like a wet firecracker. For instance:
There is no evidence that surface water and groundwater drought frequency has changed over the last few decades, although impacts of drought have increased mostly due to increased water demand.

Economic losses due to extreme weather events have increased globally, mostly due to increase in wealth and exposure, with a possible influence of climate change (low confidence in attribution to climate change).

Some low-lying developing countries and small island states are expected to face very high impacts that, in some cases, could have associated damage and adaptation costs of several percentage points of GDP.

... most recent observed terrestrial-species extinctions have not been attributed to recent climate change, despite some speculative efforts (high confidence).

With these recognized limitations, the incomplete estimates of global annual economic losses for additional temperature increases of ~2°C are between 0.2 and 2.0% of income ... .

Oddly enough, precisely the same evidence can be used against nuts on the other end of the spectrum, such as the gentleman in one thread who claimed that the IPCC had a budget in excess of twelve billion dollars. Pointing out to him that the actual budget, available on the web, came to about eleven million dollars had no effect. If, as he confidently believes, the IPCC is a massive fraud, inventing global warming out of thin air for its own sinister purposes, why should I be so naive as to believe their account of their budget? Pointing to webbed data on global temperature, which has increased by about  one degree C since 1910, would be no more effective, since he can, and probably would, claim that the data are fake. 

What he cannot explain away so easily is the modesty of the IPCC's claims. If, as he (correctly) believes, they are trying to scare people into doing something about global warming and if, as he (incorrectly) believes, they are unconstrained by actual evidence and science, why don't they tell a better story? Two degrees of warming over the next 86 years, a foot or two of sea level rise, are not very impressive threats, despite all the rhetorical efforts of the IPCC and its supporters. Why don't they make it ten degrees and ten feet? Twenty feet? A hundred feet? Why don't they tell something closer to the story that their nuttier supporters want to believe?

Saturday, October 18, 2014

Climate: The Implication of Uncertainty

Anyone who looks seriously at climate issues should recognize that the consequences of climate change are very uncertain. My own view is that they are sufficiently uncertain to raise serious doubts about the sign as well as the size of the effect, that warming due to human production of greenhouse gases might well make us better off rather than worse off. Even if I am wrong and the effect is almost certainly negative, how negative it will be is very uncertain. CO2 emissions might fall sharply due to increases in the cost of fossil fuels or decreases in the cost of alternatives. For a given value of emissions, varying estimates of climate sensitivity imply at least a factor of two range for the resulting temperature. For a given increase in temperature, the effect on humans depends on what humans will be doing for the next century. Diking against a meter of sea level change could be a serious problem for Bangladesh if it happened tomorrow. If Bangladesh follows the pattern of China, where GDP per capita has increased twenty fold since Mao's death, by the time it happens they can pay the cost out of small change.

A possible response to this point is to argue that uncertainty is no argument against action. One simply replaces the uncertain range of outcomes with the best estimate one can provide of its expected value, the average of costs weighted by their probability, and acts as if that were the known consequence of warming. If the estimate of expected cost is ten trillion dollars, then any precaution to prevent it that costs less than ten trillion is worth taking.

It is a possible response and a popular one, but it is wrong for a reason that ought to be obvious to (at least) economists. The question we are answering is not "what should we do?" but "what should we do now?" Waiting may raise the cost of dealing with the problem but it will also provide additional information. The more information we have, the better our ability to decide what precautions are worth taking. Or not worth taking. Uncertainty that will be reduced over time is an argument against immediate action.

The usual rhetorical response is to claim that we barely have time to act at all, that if we wait more than a very short time it will be too late. This claim becomes less persuasive the more times it is made, and it has  been made, by various people, quite a large number of times over the past twenty years or so. It largely depends on picking some arbitrary temperature change, most commonly two degrees C, and treating it as if it were the end of the world. As salesmen commonly put it, "Buy Now—This Is Your Very Last Chance To Take Advantage of Our Special Offer."

For a more realistic opinion, consider an estimate of the cost of waiting by William Nordhaus, an economist who has specialized in climate issues. In the course of a piece arguing for immediate action against climate change, he reported his estimate of how much greater the cost of climate change would be if we waited fifty years to deal with it instead of taking the optimal action at once.  The number was $4.1 trillion. He took that as an argument for action, writing that "Wars have been started over smaller sums." 

As I pointed out in a post here responding to Nordhaus, the cost is spread over the entire world and a long period of time. Annualized, it comes to something under .1% of world GNP.
"Thought before action, if there is time."
(quote from a character in a Dick Francis novel)
And there usually is.

Monday, June 23, 2014

Interesting Post About the Climate Argument

I came across a recent piece discussing evidence about beliefs on climate issues. It finds  that Democrats mostly believe temperatures are warming due to human action and something must be done about it, Republicans mostly don't, but that the difference is not due to differing perceptions about what climate scientists believe. If the question is not what is true but what most climate scientists believe, Republicans and Democrats give roughly similar answers—correct in some cases, incorrect in others.

The author's conclusion is that the debate has become a status conflict, with each side taking the position that it is wise and good, the other side the opposite. One implication he draws is that the campaign to persuade people that 97% of climate scientists agree is based on the mistaken assumption that the reason people are not persuaded is that they don't know what climate scientists believe.

It struck me that his description fits my observations of the online debate. Most participants appear confident that their side is right, the other side stupid or evil. Most of the posts and comments are attempts by one side to put down the other. Substantive arguments occasionally appear, but they are largely cut and paste from popular web sites on the side of whoever is posting them.

I should add that I do not think it is clear what climate scientists believe. As best I can tell by my involvement in the argument, most such scientists think global temperature has been trending up and humans are at least partly responsible, many, perhaps a majority, think humans are mainly responsible. I have seen no evidence of what percentage take the next two steps, the conclusion that if nothing is done the results will be terrible and the further conclusion that there is something that can be done that is worth doing. But those steps are essential for the policy argument that one side of the dispute is pushing and the other side opposing.

As of 5:50 EST 6/23/14 the piece described in this post appears to have vanished. I have not yet figured out why or where, if anywhere, I can find it again.

After an exchange of emails with the author, who turned out to be someone I knew from my time at U of C Law school, the link is now fixed.

Sunday, November 22, 2009

Science, Journalism, and (self) Censorship

I was recently struck by the contrast between two news stories on the same event, the publication of thousands of emails and documents from a climate research group in Britain, obtained by hacking into their computers. The Wall Street Journal story described the contents of what had been taken and published to the internet:

"In several of the emails, climate researchers discussed how to arrange for favorable reviewers for papers they planned to publish in scientific journals. At the same time, climate researchers at times appeared to pressure scientific journals not to publish research by other scientists whose findings they disagreed with."

...

"More recent exchanges centered on requests by independent climate researchers for access to data used by British scientists for some of their papers. The hacked folder is labeled "FOIA," a reference to the Freedom of Information Act requests made by other scientists for access to raw data used to reach conclusions about global temperatures.

Many of the email exchanges discussed ways to decline such requests for information, on the grounds that the data was confidential or was intellectual property. In other email exchanges related to the FOIA requests, some U.K. researchers asked foreign scientists to delete all emails related to their work for the upcoming IPCC summary. In others, they discussed boycotting scientific journals that require them to make their data public."

The other story was from the BBC, currently my first source for online news. It discussed the successful hacking—and said nothing at all about what was found.

I was reminded of the verse by Humbert Wolfe (of whom I know nothing else—I encountered it in something written by George Orwell).

"There is no way to bribe or twist
Thank God the British Journalist.
But seeing what the man will do
Unbribed, there's no occasion to"

------------------------------
A few more quotes
(added to the post later)

I noticed a few more quotes, this time from the Washington Post, and wondered how those defending the emails in comments here would react to them:

In one e-mail, the center’s director, Phil Jones, writes Pennsylvania State University’s Michael E. Mann and questions whether the work of academics that question the link between human activities and global warming deserve to make it into the prestigious IPCC report, which represents the global consensus view on climate science.

“I can’t see either of these papers being in the next IPCC report,” Jones writes. “Kevin and I will keep them out somehow — even if we have to redefine what the peer-review literature is!”

In another, Jones and Mann discuss how they can pressure an academic journal not to accept the work of climate skeptics with whom they disagree. “Perhaps we should encourage our colleagues in the climate research community to no longer submit to, or cite papers in, this journal,” Mann writes. . . .

Is pressuring a journal not to accept work you disapprove of by getting colleagues not to cite papers published in that journal a legitimate tactic?

Wednesday, February 26, 2014

A Climate Falsehood You Can Check for Yourself

One problem in arguments about climate (and many other things) is that most of the information is obtained at second, third, or fourth hand, with the result that what you believe depends largely on what sources of information you trust. One result is that people on either side of the argument can honestly believe that the evidence strongly supports their view. They trust different sources; different sources report different evidence. It is thus particularly interesting when on some point, even a fairly minor one, you can actually check a claim for yourself. I believe I have found an example of such a claim.

Cook et. al. (2013) is the paper, possibly one of two papers, on which the often repeated claim that 97% of climate scientists support global warming is based. Legates et. al. (2013) is a paper which criticizes Cook et. al. (2013). Bedford and Cook (2013) is a response to Legates et. al. All three papers (the last a pre-publication version) are webbed, although Legates et. al. is unfortunately behind a pay wall.
Bedford and Cook (2013) contains the following sentence: "Cook et al. (2013) found that over 97% endorsed the view that the Earth is warming up and human emissions of greenhouse gases are the main cause."
To check that claim, look at Cook et. al. 2013. Table 2 shows three categories of endorsement of global warming reflected in the abstracts of articles. Category 1, explicit endorsement with quantification, is described as "Explicitly states that humans are the primary cause of recent global warming." Category 2 is explicit endorsement without quantification. The description, "Explicitly states humans are causing global warming or refers to anthropogenic global warming/climate change as a known fact" is ambiguous, since neither "causing" nor "anthropogenic global warming" specifies how large a part of warming humans are responsible for. But the example for the category is clearer: 'Emissions of a broad range of greenhouse gases of varying lifetimes contribute to global climate change.' If human action produces ten percent of warming, it contributes to it, hence category 2, as implied by its label, does not specify how large a fraction of the warming humans are responsible for. Category 3, implicit endorsement, again uses the ambiguous "are causing," but the example is '...carbon sequestration in soil is important for mitigating global climate change,' which again would be consistent with holding that CO2 was responsible for some but less than half of the warming. It follows that only papers in category 1 imply that "human emissions of greenhouse gases are the main cause." Authors of papers in categories 2 and 3 might believe that, they might believe that human emissions of greenhouse gases were one cause among several.
Reading down in Cook et. al., we find "To simplify the analysis, ratings were consolidated into three groups: endorsements (including implicit and explicit; categories 1–3 in table 2)." It is that combined group, ("endorse AGW" on Table 4) that the 97.1% figure refers to. Hence that is the number of papers that, according to Cook et. al., implied that humans at least contribute to global warming. The number that imply that humans are the primary cause (category 1) is some smaller percentage which Cook et. al. do not report.

It follows that the sentence I quoted from Bedford and Cook is false. Cook et. al. did not find that "over 97% endorsed the view that the Earth is warming up and human emissions of greenhouse gases are the main cause." (emphasis mine). Any interested reader can check that it is false by simply comparing the two papers of which Cook is a co-author. John Cook surely knows the contents of his own paper. Hence the sentence in question is a deliberate lie.

That Cook misrepresents the result of his own research does not tell us whether AGW or CAGW is true. It does not tell us if it is true that most climate scientists endorse AGW or CAGW. It is nonetheless interesting, for two related reasons.

In recent online exchanges on climate, I repeatedly encountered the claim that 97% of climate scientists believed humans were the main cause of global warming. That included an exchange with one of the very few reasonable and civil supporters of the CAGW claim that I encountered in the online arguments, where most participants on either side are neither. So far as I know, the paper says nothing that is not true. But it appears designed to encourage the misreading that actually occurred. It does so by lumping together categories 1-3 and reporting only the sum and by repeatedly referring to "the consensus" but never stating clearly what that consensus is. 

The closest it came to defining the consensus is as the "position that humans are causing global warming," which leaves it unclear whether "causing" means "are one cause of," "are the chief cause of," or "are the sole cause of." To discover that it meant only the former, a reader had to pay sufficiently careful attention to the details of the paper to notice "contribute to" in the example of category 2 in Table 2, which few readers would do. The fact that Cook chose, in a second paper, to misrepresent the result of the first is pretty good evidence that the presentation of his results was deliberately designed to mislead.

There is a second, and more important, reason why all of this matters. Beliefs on either side depend largely on what sources of information you trust. I have now provided unambiguous evidence, evidence that anyone on either side willing to carefully read Cook (2013) and check what it says against what Bedford and Cook claims it says can verify for himself, that John Cook cannot be trusted. The blog Skeptical Science lists John Cook as its maintainer, hence all claims on that blog ought to be viewed with suspicion and accepted only if independently verified. Since, as a prominent supporter of the position that warming is primarily due to humans and a very serious threat, Cook is taken seriously and quoted by other supporters of that position, one should reduce one's trust in those others as well. Either they too are dishonest or they are over willing to believe false claims that support their position.

The fact that one prominent supporter of a position is dishonest does not prove that the position is wrong. For all I know, there may be people on the other side who could be shown to be dishonest by a similar analysis. But it is a reason why those who support that side because they trust its proponents to tell them the truth should be at least somewhat less willing to do so.

P.S. A commenter has located the data file for Cook et. al. (2013). By his count, the number of articles classified into each category was:

Level 1 = 64
Level 2 = 922
Level 3 = 2910
Level 4 = 7970
Level 5 = 54
Level 6 = 15
Level 7 = 9

The 97% figure was the sum of levels 1-3. Assuming the count is correct—readers can check it for themselves—that 97% breaks down as:

Level 1: 1.6%
Level 2: 23%
Level 3: 72%

Only Level 1 corresponds to "the Earth is warming up and human emissions of greenhouse gases are the main cause." (emphasis mine) Hence when John Cook attributed that view to 97% on the basis of his Cook et. al. (2013) he was misrepresenting 1.6% as 97%. Adding up his categories 5-7, the levels of rejecting of AGW, we find that more papers explicitly or implicitly rejected the claim that human action was responsible for half or more of warming than accepted it. According to Cook's own data.

Would anybody now like to claim that lumping levels 1, 2, and 3 together and only reporting the sum was not a deliberate attempt to mislead?

P.S. John Cook eventually responded to my criticism, not here but on the comment thread of another blog that linked to this one. See his response and my comments on it here.

Friday, March 18, 2022

Land Gained and Lost: A Fermi Estimate

Climate change affects the amount of land usable by humans in at least three different ways. Land is lost through sea level rise. Land is lost because it becomes too hot for human use. Land is gained because it becomes warm enough for human use. Exact calculations of the size of all three effects, if possible at all, would require much more expertise and effort than I am bringing to the problem so what I offer are Fermi estimates, numbers based on very crude approximations. For all three estimates I will be assuming warming of 3°C above current temperatures and sea level rise of .6 m above present sea level, roughly what the latest IPCC report projects for the end of the century under SSP3-7.0.

Land Lost to Sea-level Rise

The amount of land lost equals the length of coastline times the amount by which it shifts in. For the total length of the world’s coastline I found a figure of 356,000 km. The amount by which coastline shifts in with a given amount of sea level rise depends on the slope of the coastal land. I came across a figure of a hundred feet of shift for every foot of sea level rise in a book discussing the situation on the U.S. Atlantic coast; since I do not have figures for every coast in the world, I will use that.

60m coastline shift x 356,000 km of coastline = 21,436 km2

That is my very approximate estimate of land lost to sea level rise.

Land Lost to Rising Temperature

How much does temperature rise in hot parts of the world with 3° more of global warming? Figure SPM.5b of the latest IPCC report[1] shows a map of projected average temperature change due to a 4° increase relative to 1850-1900 in average global temperature, roughly 3° relative to current temperature. Parts of the Earth that are both hot and densely populated appear to warm by a little less than the global average. Table 11.SM.2 shows the effect of different levels of global warming on maximum temperatures. It looks from that as though 3° of global warming would raise the maximum temperature of the relevant regions[2] by about 3°. So if we knew at what temperature, average or maximum, the Earth’s surface becomes too hot for human habitation, we could conclude that any area currently within three degrees of that would, with our assumed level of global warming, become too hot for humans.

The simplest approach to doing this is to compare a map of global temperature (Figure1 ) to a map of population density (Figure 2) and see at what temperature population density goes to close to zero. Comparing the two maps we observe that while the coldest areas of the globe are essentially empty, the hottest are not; some, such as the Philippines, Senegal, and Malaysia, are densely populated. If there is a temperature at which the Earth’s surface becomes unliveable, these maps do not show it. Our estimate of the amount of land lost by the direct effect of heating, calculated in this way, is zero.

We may be able to do a little better by looking at data on cities. The hottest city, by average temperature, is Assab, Eritrea, at 30.5°C, with several others nearly that warm. Hence we can conclude that any city whose average temperature after climate change is less than 30.5° will not be unliveably hot while cities whose temperature is higher than that might be. There are 28 cities with an average temperature of 28°C or more. Their a combined population is about 33 million, which is roughly .7% of the urban population of the world. If we use urban population ratio as a very rough proxy for total population ratio and that as a very rough proxy for land ratio and calculate.7% of the non-arctic land area of Earth, we get 

149 million km2 (Land area) – 5.5 million (Antarctica) - .8 million (Greenland) = 143 million km2

143 million km2 x.007 = 1 million km2

That gives us a very approximate upper bound for the amount of land that becomes unlivable due to global temperature increasing by three degrees. It is only an upper bound because we do not know that a city would be unliveable at an average temperature of 31°, only that there are no cities that hot.

Both of these calculations are based on average temperature. Arguably what habitability depends on is be maximum temperature. If it gets unendurably hot during a summer day, the fact that winter nights are cold is little compensation.

Figure 3 is the equivalent of Figure 1 for maximum temperatures. The highest temperature regions it shows include densely populated parts of India as well as more sparsely populated parts of Africa and Arabia. Insofar as one can tell from that map, there are no places large enough to show on the map where maximum temperatures are too high for human habitation. It is possible that some would be that hot after an additional three degrees of warning but the combined evidence of Figures 2 and 3 suggests not, since some of the hottest regions are densely populated.

I have been defining usable land as land humans can live on. While there are parts of Earth that seem crowded, average land per person is about five acres, so human populations are not limited by the amount of space to put them in. They might, however, be limited by not enough land to feed them, so it might make more sense to define usable land as land suitable for growing crops.

Is there any significant amount of land that is too hot to grow crops? So far as I can tell, there is not. Maps showing yield of various crops can be found online; some regions with high average and maximum temperatures show substantial yields. The yields shown are averaged over countries, but a map of agriculture in India shows crops being grown across areas within India of both high average and high maximum temperature.

My conclusion from these calculations is that there is probably no substantial amount of land area that will become either uninhabitable or unable to grow crops solely because of temperature with global warming of 3°C.

This does not mean that there is no area that will become either uninhabitable or unable to grow crops as a result of global warming, only that there is no area where it will happen solely because of temperature. Looking at Figure 2, one observes a wide region of northern Africa with almost nobody living there — the Sahara. That area is less hot than some populated regions, so temperature is not the entire reason it is empty, but it can be, almost surely is, part of the reason, so increased temperature might expand it.

On the other hand, the latest IPCC report suggests the possibility that climate change might have the opposite effect:

Some climate model simulations suggest that under future high-emissions scenarios, CO2 radiative forcing causes rapid greening in the Sahel and Sahara regions via precipitation change (Claussen et al., 2003; Drijfhout et al., 2015). For example, in the BNU-ESM RCP8.5 simulation, the change is abrupt with the percentage of bare soil dropping from 45% to 15%, and percentage of tree cover rising from 50% to 75%, within 10 years (2050-2060) (Drijfhout et al., 2015). However, other modelling results suggest that this may  be a short-lived response to CO2 fertilization (Bathiany et al., 2014).

In summary, given outstanding uncertainties in how well the current generation of climate models capture land-surface feedbacks in the Sahel and Sahara, there is low confidence that an abrupt change to a greener state will occur in these regions before 2100 or 2300.

Figuring out all consequences of climate change for the amount of land available for human use is a much more complicated problem than I am trying to solve.

Land Gained Due to Rising Temperature

Human land use at present is limited by cold, not heat, as shown on Figure 2 above — the equator is populated, the polar regions are not. It follows that global warming, by shifting temperature contours towards the poles, should increase the amount of land warm enough for human habitation. Making Antarctica habitable would require a lot more than three degrees of global warming and the southernmost land masses north of it are already inhabited, so any land gains from warming will be in the northern hemisphere.

Figure 11.SM.1 of the sixth IPCC report shows minimum temperature of areas such as North America and Northern Asa going up by between 2 and 3.4 degrees per degree of global warming. Since warming is greater in colder climates, I take 3 degrees per degree as a reasonable guess for the increase in temperature in the northern part of those zones. It follows that three degrees of global warming will increase the temperature in the colder parts of those zones by about nine degrees. To estimate how much land will shift from not quite habitable to at least barely habitable we need two numbers — what length of the contour dividing barely habitable from not quite habitable is over land and how far a nine degree increase in temperature will shift it.

It seems likely that habitability depends more on minimal temperature than on average temperature. Figure 4 shows temperatures in January, which should be close to the minimum, with contours every five degrees — much more precise information than Figure 1 provides for average temperatures. Combining the temperature information on Figure 4 with the population density information on Figure 2, the border of habitability appears to be at about -15°C. Nine degrees of warming will raise the January temperature of land currently at -24° to -15°, so shift the land between those two contours from not quite habitable to barely habitable. I estimate the distance between the -15° and -25° contours to average about 800 km, making the distance between -15° and -24° about 720 km, and the length over land of those contours to total about 15,000 km. Hence the area between them is about 10,800,000 km2.

This land is being warmed from not quite habitable to at least barely habitable, from a population density of less than two per square km to a population density of more than two but in some areas less than ten. At the same time, the land a little farther south is being warmed from barely habitable to more than barely habitable, and the land south of that …  . Combining those effects, 10.5 million square km is a rough estimate of the increase in fully usable land.

The analysis so far has used population density as the measure of habitability. As I suggested earlier, it may make more sense to use the ability to grow crops. Crop production maps for Canada and Russia show crops growing in about the same areas that appear habitable by population density, so I have not tried to redo the calculation on that basis.

Conclusion

On the basis of these calculations, I find, for the effect of climate change by the end of the century under SSP3-7.0:

Loss of usable land by flooding due to sea level rise: 21,436 km2

Loss of usable land due to the direct effect of warming: Probably close to zero, with one calculation giving an upper bound of one million km2.

Increase of usable land due to the direct effect of warming: 10.8 million km2.

All of these numbers are very approximate but they imply a large net increase, due to climate change, in the amount of land usable by humans — more than twice the area of the United States. They also imply that nearly five hundred times as much land is gained through warming as is lost through sea level rise, which makes it odd that only the latter is commonly included in discussions of the effects of climate change.

P.S. Two commenters on this in different places asked why I didn't discuss other work along these lines and one of them provided a link to “Climate change impacts on global agricultural land availability” by Xiao Zhang and Ximing Cai 2011 Environ. Res. Lett. 6. It is a more elaborate analysis than mine, focusing on the amount of arable land and trying to take account of a  wider range of constraints including soil quality and humidity. It finds increases in some regions, decreases in others, with the net effect, not including land not available because of population increase, ranging from -.8 million km2 to +1.2 million km2. Details of their analysis are difficult to extract from the article — I could not tell, for example, whether the effect of CO2 fertilization on the water requirement of plants is one of the effects they take into account. The analysis in this chapter is less sophisticated but much easier for the reader to audit, to figure out what I am doing and whether to trust the result.

A similar calculation is done in Ramankutty N et al 2002,  The global distribution of cultivable lands: current patterns and sensitivity to possible climate change,” Global Ecol. Biogeogr. 11 377–92. That article explicitly takes account of the reduction in water requirements due to CO2 fertilization. The authors conclude “In the GCM-simulated climate of 2070–99, we estimate an increase in suitable cropland area of 6.6 million km2.” Since I am estimating land warm enough for human use and they are estimating land suitable for cultivation, taking account of a variety of constraints, it is not surprising that their figure is lower than mine. The Sahara, for example, is warm enough for human use — there are densely populated regions that are warmer — but not suitable for cultivation.

-------------------------

This is a draft of a chapter for a book I am working on. I am looking for two sorts of comments:

1. Easy ways of doing my calculations better. There are obviously ways I could make my results more accurate by more complicated calculations but since I don't really care if the real number is twice mine or half it, that isn't worth doing. On the other hand, if there are ways just as easy but smarter, giving a more reliable result, I am interested.

2. Major mistakes. My conclusions are pretty dramatic and I want to know if they are, for some reason, wildly wrong.


[1] This and other references to IPCC figures in this chapter are to IPCC AR6 WGI Full Report.

[2] SAS, EAS, SEA, and CAF in the table.


Friday, June 27, 2014

Another Good Article by Dan Kahan

The source of the public conflict over climate change is not too little rationality but in a sense too much. Ordinary members of the public are too good at extracting from information the significance it has in their everyday lives. What an ordinary person does—as consumer, voter, or participant in public discussions—is too inconsequential to affect either the climate or climate-change policymaking. Accordingly, if her actions in one of those capacities reflects a misunderstanding of the basic facts on global warming, neither she nor anyone she cares about will face any greater risk. But because positions on climate change have become such a readily identifiable indicator of ones’ cultural commitments, adopting a stance toward climate change that deviates from the one that prevails among her closest associates could have devastating consequences, psychic and material. Thus, it is perfectly rational—perfectly in line with using information appropriately to achieve an important personal end—for that individual to attend to information on in a manner that more reliably connects her beliefs about climate change to the ones that predominate among her peers than to the best available scientific evidence.
His empirical claim is that disbelief in global warming, or in evolution, is not evidence of scientific ignorance. If you separate groups on roughly a left/right basis, belief in warming increases with increasing scientific intelligence (measured in other ways) in the group predisposed to believe in it (left), decreases with increasing scientific intelligence in the group predisposed not to believe in it (right). Similarly with evolution if you divide the groups into more or less religious. His explanation ...:
If that person happens to enjoy greater proficiency in the skills and dispositions necessary to make sense of such evidence, then she can simply use those capacities to do an even better job at forming identity-protective beliefs.
The article is too long and starts with an irrelevant analogy to observer effects in quantum mechanics, but it has lots of interesting stuff in it. Among other things, if you test people to see how much they understand about the theory of evolution, those who believe in it do no better than those who don't. Similarly for global warming.


Thursday, October 21, 2021

Have Past IPCC Temperature Projections/Predictions Been Accurate?

Arguments for or against doing things to slow climate change depend on what will happen if we don’t, a question the IPCC reports try to answer. That makes it important to know how reliable their predictions are. The latest report runs to almost four thousand pages, largely of detailed analysis depending on multiple scholarly articles for each step — Chapter 7, to pick one at random, has fifty editors and about nine hundred articles in its list of references. Someone with infinite time, energy and expertise might be able to go through all of the calculations that produced the predictions in the reports in order to see if they were done correctly, but that is not a practical option.

There is an alternative. The climate system is too complicated to make predictions on the basis of theory alone, hence the IPCC project largely consists of sophisticated curve fitting, picking a form for the relationship among observables suggested by physical theory, choosing parameters for the relationships, how strong each effect is, by finding the values that best fit historical data.  With enough tweaking of the models and adjusting of parameters that process can fit past data, but that does not tell you whether the models fit the real system well enough to correctly predict future data. As someone is supposed to have said, with enough parameters you can fit the skyline of New York.

The solution, for both the researcher who wants to know if his model is right and someone else trying to decide whether to believe him, is to test the model against data that were not used in creating it. We do not know the future, the future eventually becomes the past, so a model constructed in 1990 can be tested in 2021 against data that did not exist when the model was constructed.

The past reports are webbed. Back in 2014 I looked at each to see what someone who read it would expect future temperature to do and reported the results on my blog. If you would like to check my conclusions about what each report implied for yourself you can find links to the reports here.

What the IPCC Predicted

The executive summary of the first report (1990) contains:

Under the IPCC Business-as-Usual (Scenario A) emissions of greenhouse gases, the average rate of increase of global mean temperature during the next century is estimated to be about 0.3°C per decade (with an uncertainty range of 0.2°C to 0.5°C).

The graph shown for the increase is close to a straight line at least from 2000 on, so it seems reasonable to ask whether the average increase from 1990 to the present is within that range. 

Figure 18 from the Second Assessment Report (1995) shows the future temperature through 2020. Through that date, it rises steadily at about .14°C/decade.[1]

From the Third Assessment Report (2001):[2]

For the periods 1990 to 2025 and 1990 to 2050, the projected increases are 0.4 to 1.1°C and 0.8 to 2.6°C, respectively.

For the former period, that implies an increase of from .11 to .31 °C/decade.

The Fourth Assessment Report (2007) has[3]

For the next two decades a warming of about 0.2°C per decade is projected for a range of SRES emissions scenarios.

What Happened

When I did the calculations in 2014, I found that the IPCC had predicted high four times out of four, twice by enough so that actual warming was below the bottom of the predicted range. That looked like evidence that we should not put much weight on their predictions of future temperature.

We now have seven years more data, so I did it again. As of September of 2021, when I am writing this, the last year whose temperature is shown on the NASA page I am using is 2018; I have redone the calculations accordingly. Here are the results:

The first IPCC report was released in 1990. From then to 2018, global temperature rose .38°C for an average of .14°C/decade, well below the predicted range.

The second report was released in 1995. From then to 2018, temperature rose by .37°C, for an average rate of growth of .16 °C, a little higher than the prediction.


The third report was released in 2001. From then to 2018, temperature rose by .29°C for an average of .17°C/decade, towards the lower end of the predicted range.


The fourth report was released in 2007. From then until 2018, temperature rose by .18 degrees, .16°C/decade, below the predicted .2°C.


The predictions look better now than they did in 2014, high three times out of four, low once, and only once has actual warming been below the predicted range. They are still running a little high but the results look consistent with random error. That makes it at least possible that the IPCC researchers are now modeling the climate system well enough to produce reasonable estimates of its future behavior.

It is possible but far from certain because the test they passed is not a very strong one. A theory that correctly predicted the outcome of next year’s elections, including every house seat, every senate seat, and the total votes for each party, would be a very good theory indeed, since doing that well by chance is very unlikely, so we would have good reason to trust its future predictions. A theory which correctly predicted which party will end up with a senate majority after the 2022 election would be better than one that got it wrong but not much better, since one can get the right answer half the time by flipping a coin.

The IPCC reports rely on complicated models and a lot of data. One way to judge how impressive their results are, how much evidence that they have done a good job of modelling climate, is to compare their results with those of much simpler models. The simplest is the assumption that global temperature never changes. The IPCC did a little worse than that model in 1990, since it predicted warming from then to 2018 of .3°/decade and the actual value,  .14°/decade, was closer to zero. But they did much better than that model the next three times.

The next simplest model is a straight line. From 1910, about when current warming started, to 1990, when the first IPCC report came out, warming was .11 °C/decade. The rate of warming from 1990 to 2018 was .14 °C/decade, so the straight-line prediction made in 1990 predicts about 79% of warming from then to 2018. The ratio of the IPCC prediction to what actually happened was 250% for the 1990 prediction, 81% for the 1995, 125% for the 2001 and 2007 predictions.[4] So predicting that the rate of warming would continue at its average level as of 1990 does much better than the 1990 prediction, about as well as the three later ones.

One test of how good the IPCC models are is to see how well each of them did at predicting warming from then to now. The first report fails that test, the next three pass it; actual warming was within their predicted range although not equal to their best guess. That is evidence that those models can be expect to give correct predictions in the future but not very strong evidence. 

It is, however, much better than the evidence was in 2014.


[1] The figure is on page 323 of Climate Change 1995 The Science of Climate Change. When I did my calculations in 2014 I thought it was .13°/decade but measuring the graph more carefully I now think it is .14.

[4] I am defining each of the IPCC predictions as the predicted value if there is one or the center of the range if there isn’t.

Monday, September 05, 2011

What is Wrong with Global Warming Anyway?

The argument for large and expensive efforts to prevent or reduce global warming has three parts, in principle separable: Global temperature is trending up, the reason is human activity, and the consequences of the trend continuing are very bad. Almost all arguments, pro and con, focus on the first two. The third, although necessary to support the conclusion, is for the most part ignored by both sides.

The usual argument to show that an increase in global temperatures by a few degrees centigrade over the next century would be a catastrophe, or at least a very bad thing, consists of pointing out specific bad effects: rising  sea level increasing the risk of flooding in very low lying areas, rising temperature making particular areas less suited to growing the crops they now grow. But an increase in global temperature would also have good effects, as should be obvious to anyone who has ever spent a winter in Chicago, not to mention Alaska or Siberia. The question is not whether there are any bad effects but whether there are net bad effects, whether the increased risk of flooding in Bangladesh does or does not outweigh the opening of a sea route north of Asia and the increase in the habitable area of Canada and Siberia.

The answer, I think, is that nobody knows if the net effects would be good or bad, and probably nobody can know. We are talking, after all, about effects across the world over a century. How accurately could somebody in 1900 have predicted what would matter to human life in 2000? What reason do we have to think we can do better?

Should we, for instance, assume that Bangladesh will still be a poor country a century hence, or that it will by then have followed the path blazed by South Korea, Taiwan, Singapore and Hong Kong—and so be in a position to dike its coast, as Holland did several centuries ago, or move housing some miles further inland, at a cost that can be paid out of petty change? Should we assume that population increase makes agricultural land more valuable and the expansion of the area over which crops can be grown more important, or that improvements in crop yield make it less? While there may be people who believe that they know the answer to such questions, the numbers required to justify such belief are at best educated guesses, in most cases closer to pure invention. Someone who wants to prove that global warming is bad can make high estimates for the costs, low estimates for the benefits, and so prove his case to his own satisfaction. Someone with the opposite agenda can reverse the process and prove his case equally well.

If we cannot calculate in any detail what the actual consequences of global warming and associated costs and benefits will be, an alternative is to ask whether we have any reason to expect, a priori, that costs will be larger than benefits. There are, I think, two answers.

The first is that any change, whether warming or cooling, is presumptively bad, because current human activity is optimized against current conditions. Farmers grow crops suited to the climate where they are growing them; a change in climate will require a costly change in what they grow and how they grow it. Houses are designed for the climate they are built in and located in places not expected, under current circumstances, to flood. Putting it in economic terms, we have born sunk costs based on the current environment, and a change in that environment will eliminate some of the quasi-rents that we expected as the return for those costs.

This is a real argument against rapid change. But the global warming controversy involves changes over not a year or a decade  but a century. Over a century, most farmers will change the crop they find it most profitable to grow multiple times; if average temperatures are trending up, those changes will include a shift towards crops better suited to slightly warmer weather. Over a century, most houses will be torn down and replaced; if sea level is rising, houses currently built on low lying coastal ground will be rebuilt a little farther inland—not much farther if we are talking, as the IPCC estimates suggest we should be, about a rise of a foot or two. Hence the presumption that change is bad is a very weak one for changes as slow as those we have good reason to expect from global warming.

It is hard to see any other reason to expect gobal warming to make us, on net, worse off. The earth and its climate were not, after all, designed for our convenience, so there is no good reason to believe that their current state is optimal for us. It is true that our species evolved to survive under then existing climatic conditions but, over the period for which humans have existed, climate has varied by considerably more than the changes being predicted for global warming. And, for the past many thousands of years, humans have lived and prospered over a range of climates much larger than the range that we expect the climate at any particular location to change by.

If we have no good reason to believe that humans will be substantially worse off after global warming than before, we have no good reason to believe that it is worth bearing sizable costs to prevent global warming.

Readers who reject this conclusion are invited to offer reasons why we should expect the negative effects of global warming to outweigh the positive. Readers on the other side, inclined to post comments attacking me for being so credulous as to accept the reality of anthropogenic global warming, are free to do so but should not expect any response from me, since that is not the argument I am at the moment interested in having.